> ## Documentation Index
> Fetch the complete documentation index at: https://docs.lightdash.com/llms.txt
> Use this file to discover all available pages before exploring further.
# Catalog
> Browse, explore, and curate your metrics in the Metrics Catalog
## Browsing the catalog
Browse all the project metrics you have access to (based on permissions and user-attributes) in the **Metrics Catalog**.
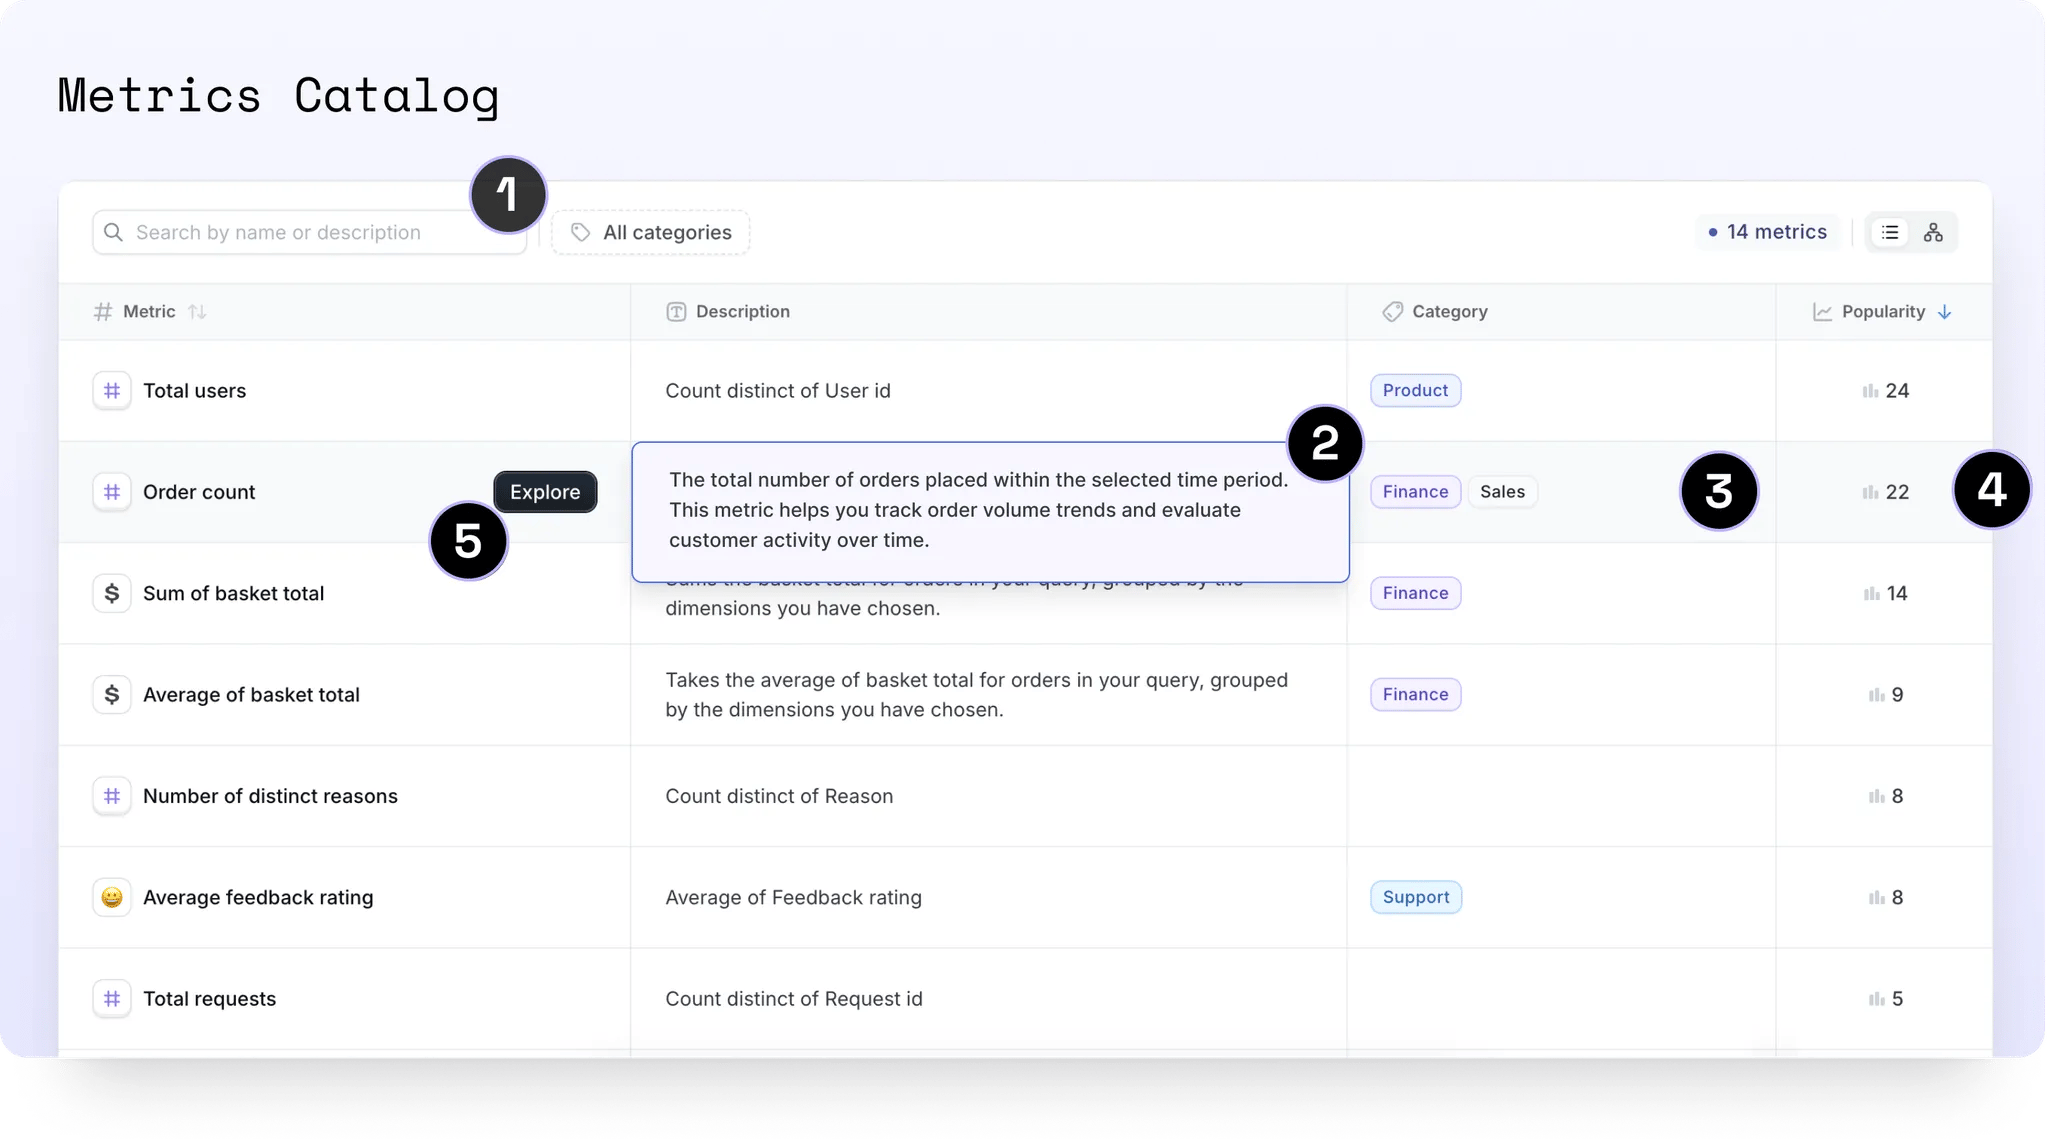 1. **Search**: Easily find metrics by their names or .yml descriptions using the searchbar.
2. **View .yml descriptions**: Click on any description to expand and view the full content, including rendered Markdown.
3. **Categories**: Use categories to streamline your metrics and KPIs. Filter metrics by category and add new ones directly in the UI. ***Users with editor permissions and above*** can click on any category cell to edit, rename, change its color, or delete it.
4. **View popularity**: Discover a metric's popularity and see where it's being used. Click to explore a complete list of charts which use the metric. Metrics are sorted by default to highlight the most used ones first.
5. **Explore**: ***Interactive viewers and above*** can dive deeper by clicking *Explore* to visualize the metric in a chart format.
## Exploring a metric
Visualize your metrics in the **Metrics Explorer**.
1. **Search**: Easily find metrics by their names or .yml descriptions using the searchbar.
2. **View .yml descriptions**: Click on any description to expand and view the full content, including rendered Markdown.
3. **Categories**: Use categories to streamline your metrics and KPIs. Filter metrics by category and add new ones directly in the UI. ***Users with editor permissions and above*** can click on any category cell to edit, rename, change its color, or delete it.
4. **View popularity**: Discover a metric's popularity and see where it's being used. Click to explore a complete list of charts which use the metric. Metrics are sorted by default to highlight the most used ones first.
5. **Explore**: ***Interactive viewers and above*** can dive deeper by clicking *Explore* to visualize the metric in a chart format.
## Exploring a metric
Visualize your metrics in the **Metrics Explorer**.
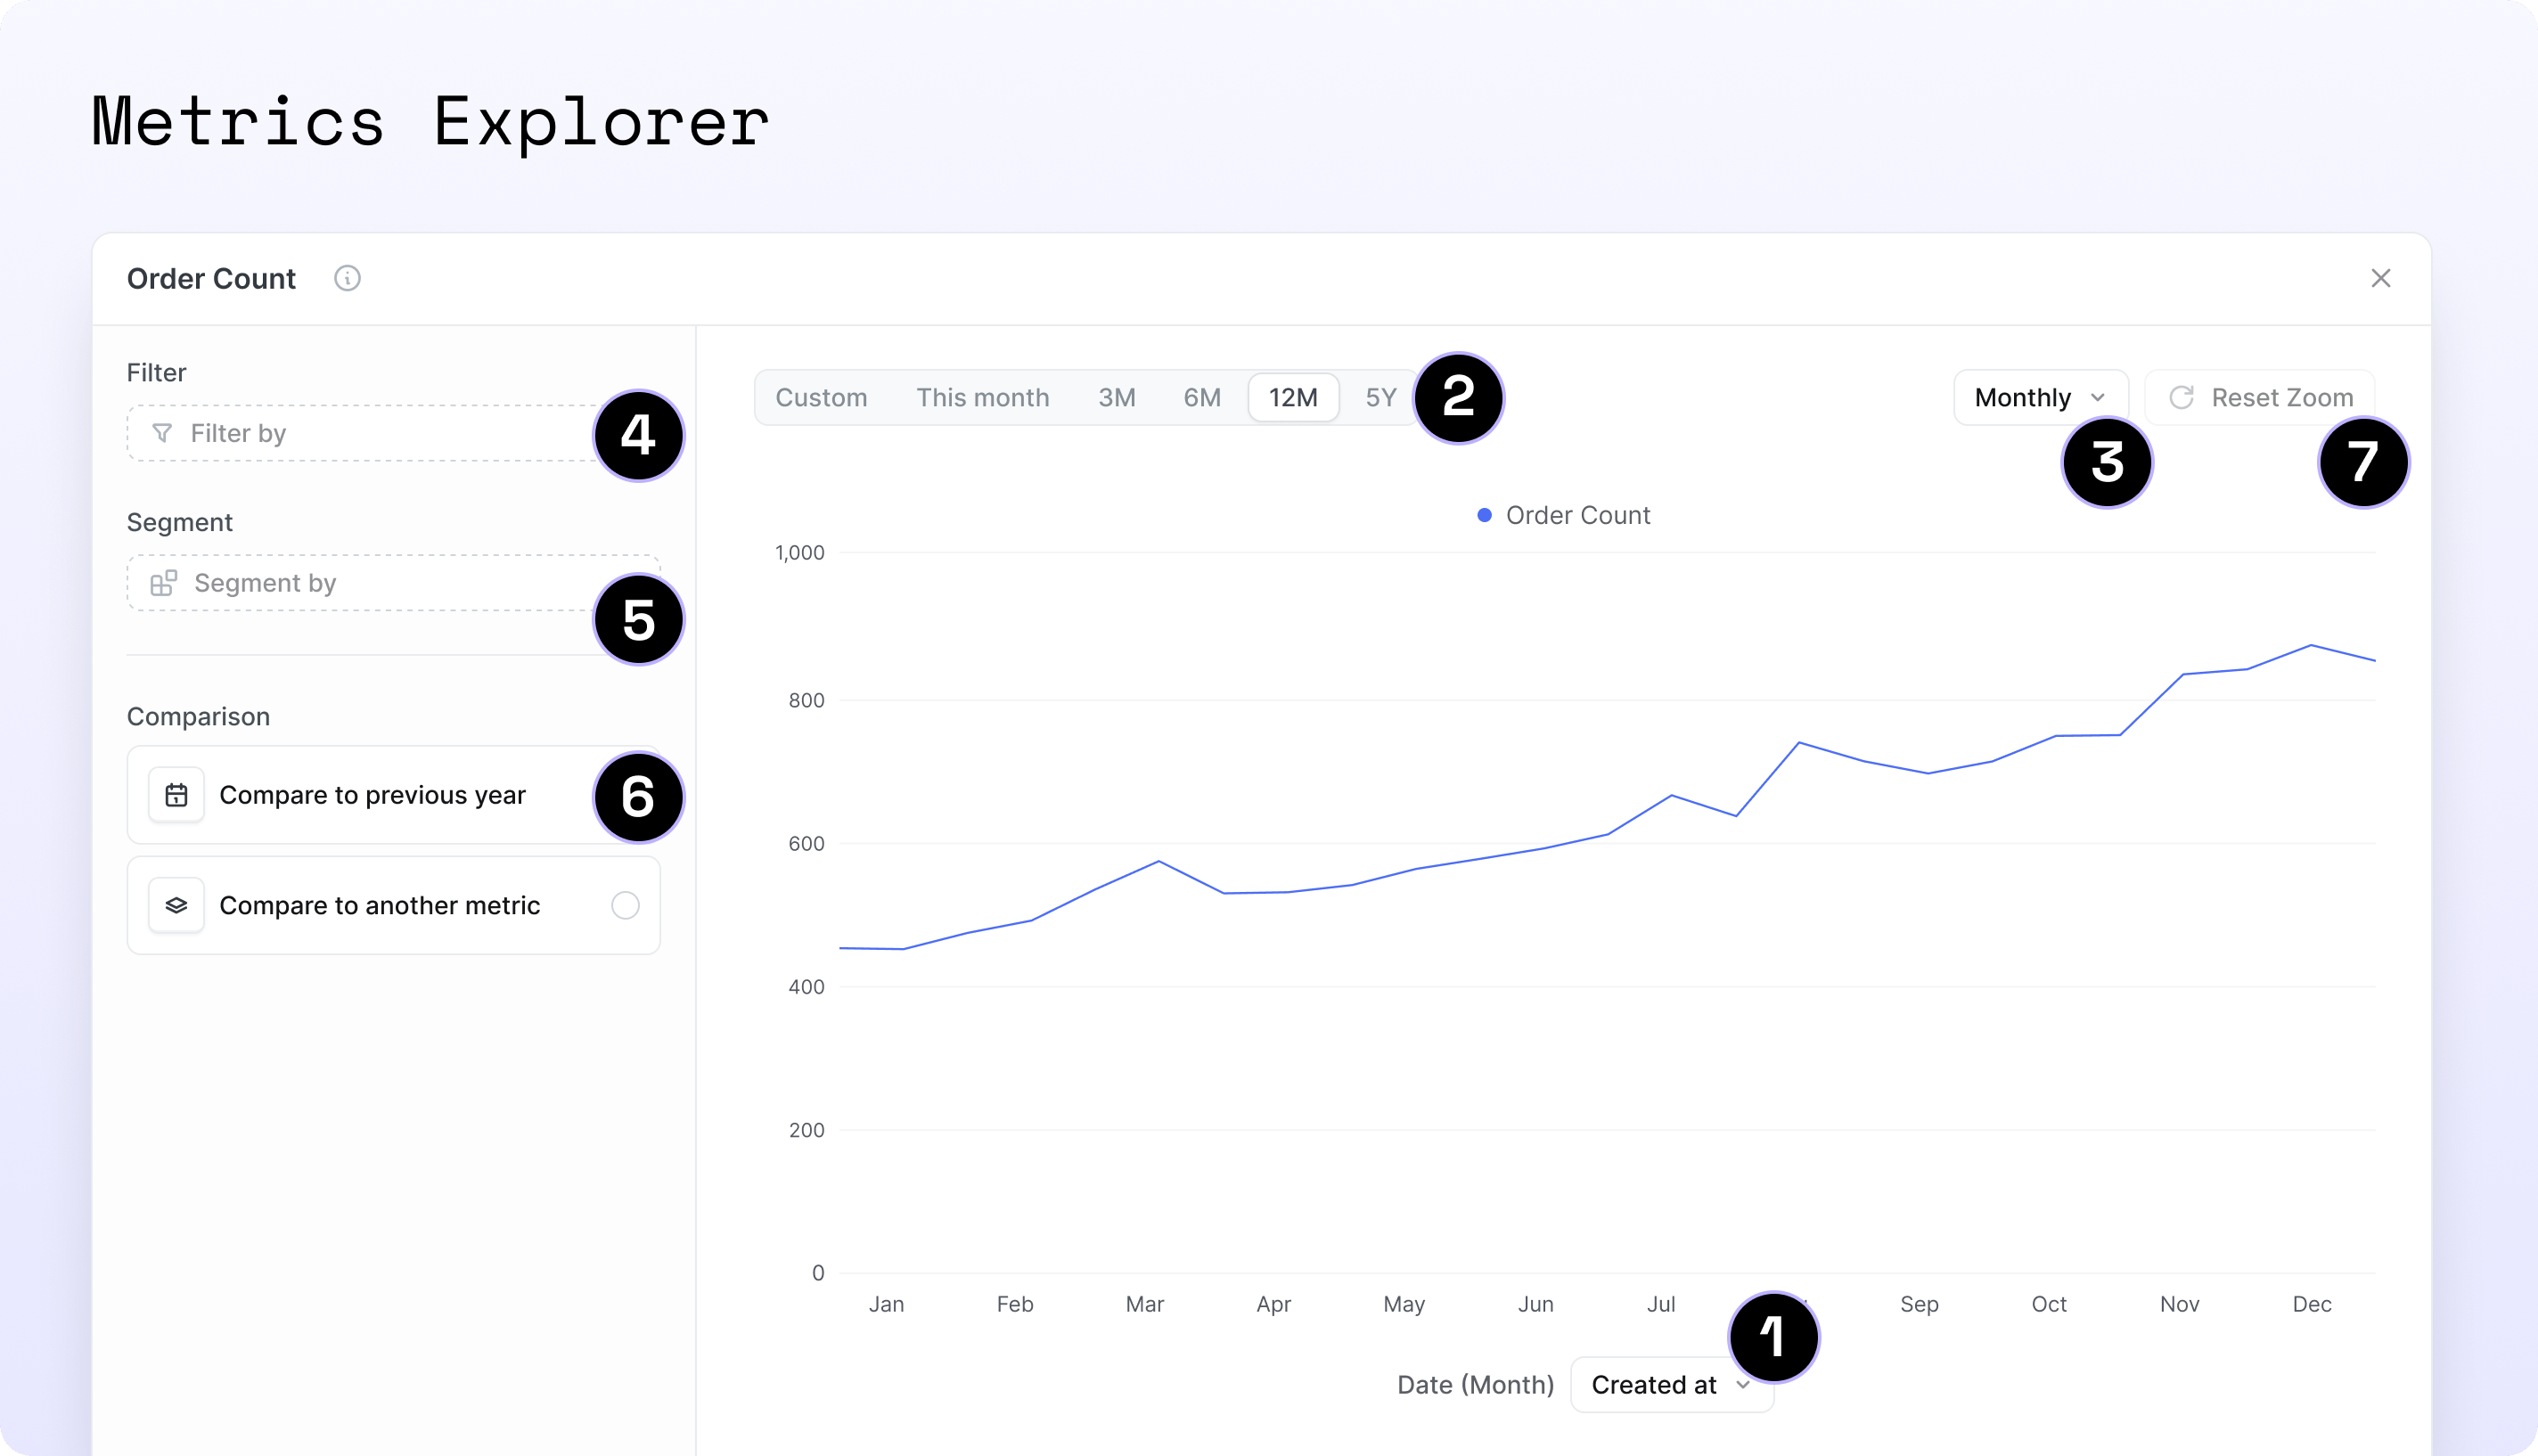 1. **Plot over time**: View your selected metric plotted over a time dimension as a line chart. You can adjust this dimension or set a default time dimension in your `.yml` to simplify the process for users. [See how](#configuring-default-time-settings-in-yml)
2. **Filter by date**: Use the date picker with convenient presets for quick selection. [See how default presets work based on the granularity](#faqs)
3. **Adjust the time granularity**: Refine your view by choosing the desired level of date granularity.
4. **Filter by a dimension:** Filter your metric by any string or boolean dimension from the same table.
5. **Segment-by**: Break down the metric by any non-time dimension in your dataset.
6. **Compare to:**
* **'This time last year'**: Compare the selected time period to the same period last year
* **'Another metric':** Compare to another metric **from the same table** that has a default time dimension specified in the `.yml`. [See how](#configuring-default-time-settings-in-yml)
Cross-table metric comparison (including joined tables) is not yet supported but is planned. See [GitHub issue #21003](https://github.com/lightdash/lightdash/issues/21003) for updates.
7. **Drag to zoom:** Click and drag across the chart to highlight the desired time range or data points, then release to zoom in on that segment. Hit 'Reset Zoom' to reset chart.
## Curating Metrics Catalog for your business users
Metrics Catalog is designed to be a tool for your business users to explore and understand your data.
To make Metrics Catalog more useful for your business users, you can curate the metrics they can see and explore.
To do this, you can:
* Control the visibility of metrics in the catalog
* Add categories to your metrics
* Add default time settings to your metrics
All through your Lightdash `.yml` files. Metrics curation is configured under the `spotlight` key — see [the `spotlight` config](/explore/metrics-catalog#the-spotlight-config) for an overview of what it covers.
### Configuring global visibility of metrics
You can control the visibility of metrics in the catalog by creating a new file called `lightdash.config.yml` in the root of your dbt project.
If you're new to lightdash.config.yml, check out our [getting started guide](/semantic-layer/lightdash-config-yml#getting-started) to learn how to create and set up this file.
See this video for an example on how to set this up:
**Step-by-step guide**
1. Add the following to your `lightdash.config.yml` file:
```yml theme={null}
spotlight:
default_visibility: show
```
**The default visibility can be set to `show` or `hide`.**
If you don't set this, the default visibility will be `show`, so all metrics will be visible in the catalog by default (but other settings like user attributes will still apply).
This will set the default visibility of metrics in the catalog to `show` for all metrics in your project. You can also set this to `hide` if you prefer to hide metrics by default and then override this on a per-model/metric basis.
2. Now that you've set the default visibility, you can override this on a per-model/metric basis.
```yml dbt v1.10+ theme={null}
models:
- name: events
config:
meta:
spotlight:
visibility: hide
```
```yml dbt v1.9 and earlier theme={null}
models:
- name: events
meta:
spotlight:
visibility: hide
```
```yml Lightdash YAML theme={null}
type: model
name: events
spotlight:
visibility: hide
```
This will hide the events model from the catalog.
3. If there are metrics in the events model that you want to make visible, you can override the default visibility for those metrics.
```yml dbt v1.10+ theme={null}
models:
- name: events
config:
meta:
spotlight:
visibility: hide
metrics:
event_count:
type: count
spotlight:
visibility: show
```
```yml dbt v1.9 and earlier theme={null}
models:
- name: events
meta:
spotlight:
visibility: hide
metrics:
event_count:
type: count
spotlight:
visibility: show
```
```yml Lightdash YAML theme={null}
type: model
name: events
spotlight:
visibility: hide
metrics:
event_count:
type: count
spotlight:
visibility: show
```
4. Once you compile your project, you'll see the `event_count` metric in the catalog, even though the events model is hidden.
### Assigning categories to metrics
Categories are a great way to organize your metrics in the catalog. You can create a new category by adding a new `categories` field to your `lightdash.config.yml` file.
Here's a video showing how to set this up:
**Step-by-step guide**
1. Add the following to your `lightdash.config.yml` file:
```yml theme={null}
spotlight:
categories:
revenue: # Required, this is the name of the category, and how it will be referenced in the catalog. It must be unique.
label: Revenue # Required, this is what will be displayed in the catalog
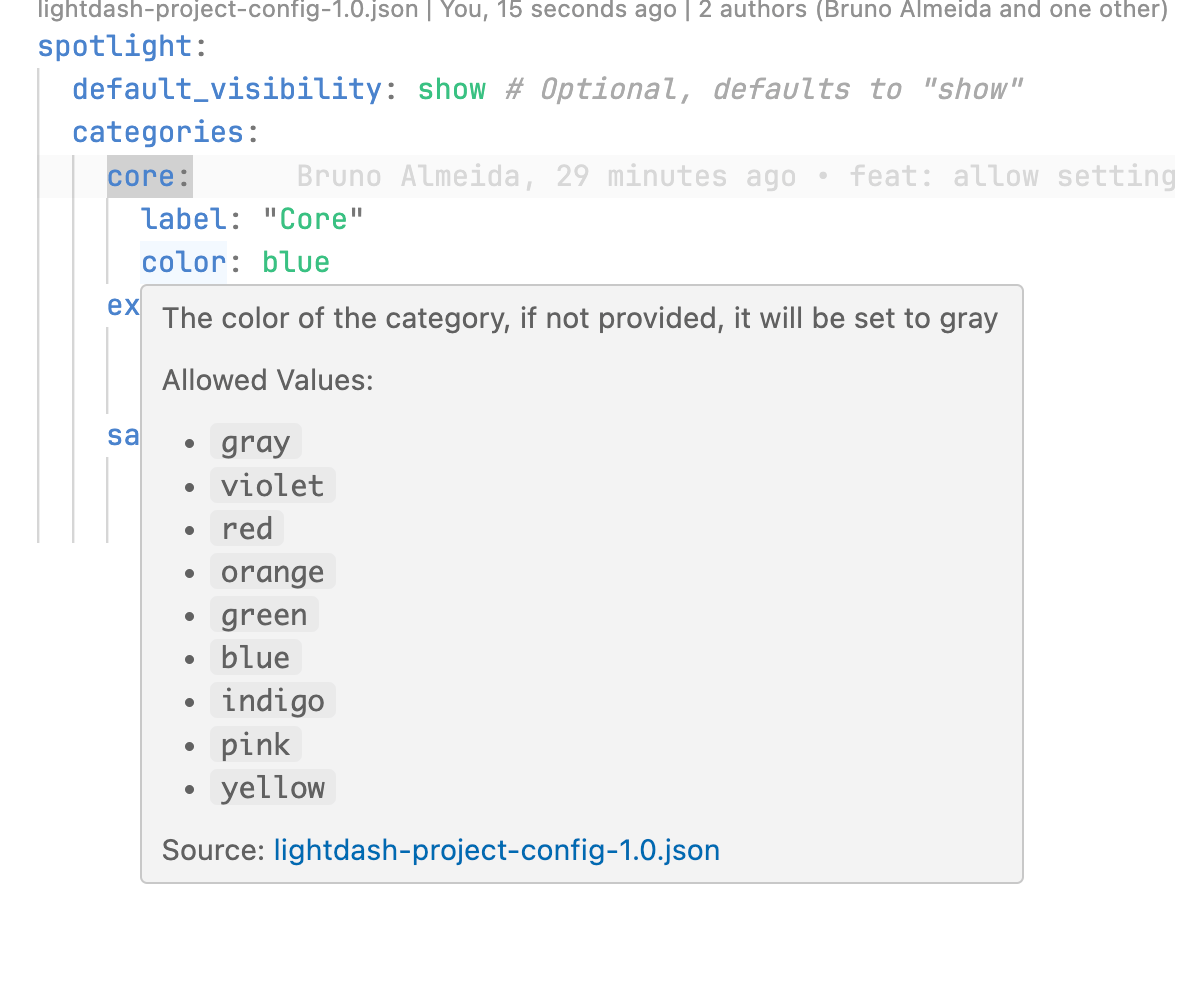
color: "orange" # Optional, defaults to "gray", with the option to choose from a range of colors: "gray", "violet", "red", "orange", "green", "blue", "indigo", "pink", "yellow"
```
2. Now that you've added a category, you can assign metrics to it by adding a `categories` field to your models `.yml` file.
```yml dbt v1.10+ theme={null}
models:
- name: events
config:
meta:
spotlight:
visibility: show
categories:
- revenue
```
```yml dbt v1.9 and earlier theme={null}
models:
- name: events
meta:
spotlight:
visibility: show
categories:
- revenue
```
```yml Lightdash YAML theme={null}
type: model
name: events
spotlight:
visibility: show
categories:
- revenue
```
This will add the `revenue` category to all metrics in the events model.
If you want to add another category to a specific metric, you can do so by adding the `categories` field to the metric's `.yml` file. And remember, you can only add categories that have been defined in the `lightdash.config.yml` file.
3. Now you can add the `marketing` category to the `event_count` metric:
So in your `lightdash.config.yml` file, you need to have another category. Let's call it `marketing` and add it to the `event_count` metric, like so:
```yml theme={null}
spotlight:
categories:
marketing:
label: Marketing
color: "blue"
revenue:
label: Revenue
color: "orange"
```
Now you can add the `marketing` category to the `event_count` metric:
```yml dbt v1.10+ theme={null}
models:
- name: events
config:
meta:
spotlight:
visibility: show
categories:
- revenue
metrics:
event_count:
type: count
spotlight:
categories:
- marketing
```
```yml dbt v1.9 and earlier theme={null}
models:
- name: events
meta:
spotlight:
visibility: show
categories:
- revenue
metrics:
event_count:
type: count
spotlight:
categories:
- marketing
```
```yml Lightdash YAML theme={null}
type: model
name: events
spotlight:
visibility: show
categories:
- revenue
metrics:
event_count:
type: count
spotlight:
categories:
- marketing
```
In this example, the `event_count` metric will have both the `marketing` and `revenue` categories, it's cumulative.
4. Once you compile your project, you'll see the `event_count` metric in the catalog with both the `marketing` and `revenue` categories and you can use this to filter your metrics in the catalog.
**The categories you define need to be unique, so you can't have two categories with the same name.**
If you try to add a category with the same name as an existing category, you'll get an error. This error will be displayed in the UI and in the terminal (if you use the Lightdash CLI) when you compile your project.
## Assigning owners to metrics
You can assign owners to metrics using the `spotlight.owner` property. The owner displays in the metrics catalog with their name and avatar.
### Set an owner at the metric level
```yaml dbt v1.10+ theme={null}
models:
- name: orders
columns:
- name: amount
config:
meta:
metrics:
total_revenue:
type: sum
spotlight:
owner: alice@yourcompany.com
```
```yaml dbt v1.9 and earlier theme={null}
models:
- name: orders
columns:
- name: amount
meta:
metrics:
total_revenue:
type: sum
spotlight:
owner: alice@yourcompany.com
```
```yaml Lightdash YAML theme={null}
type: model
name: orders
dimensions:
- name: amount
metrics:
total_revenue:
type: sum
sql: ${TABLE}.amount
spotlight:
owner: alice@yourcompany.com
```
### Set a default owner at the model level
You can set a default owner for all metrics in a model. Metric-level owners override the model-level default.
```yaml dbt v1.10+ theme={null}
models:
- name: orders
config:
meta:
spotlight:
owner: bob@yourcompany.com # default for all metrics in this model
columns:
- name: amount
config:
meta:
metrics:
total_revenue:
type: sum
spotlight:
owner: alice@yourcompany.com # overrides model owner
avg_revenue:
type: average
# inherits bob@yourcompany.com from model
```
```yaml dbt v1.9 and earlier theme={null}
models:
- name: orders
meta:
spotlight:
owner: bob@yourcompany.com # default for all metrics in this model
columns:
- name: amount
meta:
metrics:
total_revenue:
type: sum
spotlight:
owner: alice@yourcompany.com # overrides model owner
avg_revenue:
type: average
# inherits bob@yourcompany.com from model
```
```yaml Lightdash YAML theme={null}
type: model
name: orders
spotlight:
owner: bob@yourcompany.com # default for all metrics in this model
dimensions:
- name: amount
metrics:
total_revenue:
type: sum
sql: ${TABLE}.amount
spotlight:
owner: alice@yourcompany.com # overrides model owner
avg_revenue:
type: average
sql: ${TABLE}.amount
# inherits bob@yourcompany.com from model
```
* Use the email address of a Lightdash user in your organization.
* Metric-level owner takes precedence over model-level.
* You can filter by owner in the Metrics Catalog UI.
* If the email doesn't match a Lightdash user, the metric shows as "Unassigned".
## Controlling filtering and segmentation options
You can control which dimensions appear in the filter and segment-by dropdowns when exploring metrics. This helps users focus on relevant dimensions. You can also pre-apply a default segment and filter so users land on the most useful view as soon as they open a metric.
### Hide a dimension from all metrics
Use boolean values at the dimension level to hide a dimension from filter or segment-by dropdowns for all metrics in that model:
```yaml dbt v1.10+ theme={null}
models:
- name: orders
columns:
- name: internal_tracking_id
config:
meta:
dimension:
spotlight:
filter_by: false # hide from filter dropdown
segment_by: false # hide from segment-by dropdown
```
```yaml dbt v1.9 and earlier theme={null}
models:
- name: orders
columns:
- name: internal_tracking_id
meta:
dimension:
spotlight:
filter_by: false # hide from filter dropdown
segment_by: false # hide from segment-by dropdown
```
```yaml Lightdash YAML theme={null}
type: model
name: orders
dimensions:
- name: internal_tracking_id
spotlight:
filter_by: false # hide from filter dropdown
segment_by: false # hide from segment-by dropdown
```
### Allowlist specific dimensions for a metric
Use an array of dimension names at the metric level to create an allowlist of dimensions for that specific metric:
```yaml dbt v1.10+ theme={null}
models:
- name: orders
columns:
- name: amount
config:
meta:
metrics:
total_revenue:
type: sum
spotlight:
filter_by:
- status
- region
- order_date
segment_by:
- status
- customer_segment
```
```yaml dbt v1.9 and earlier theme={null}
models:
- name: orders
columns:
- name: amount
meta:
metrics:
total_revenue:
type: sum
spotlight:
filter_by:
- status
- region
- order_date
segment_by:
- status
- customer_segment
```
```yaml Lightdash YAML theme={null}
type: model
name: orders
dimensions:
- name: amount
metrics:
total_revenue:
type: sum
sql: ${TABLE}.amount
spotlight:
filter_by:
- status
- region
- order_date
segment_by:
- status
- customer_segment
```
### Set a default segment and filter for a metric
While `segment_by` and `filter_by` control which dimensions are *available*, `default_segment` and `default_filter` control which are *pre-selected* when a metric is opened. Use them when a metric is almost always viewed the same way (e.g., revenue segmented by region, or active users filtered to a specific status), so users don't have to set it up themselves every time.
```yaml dbt v1.10+ theme={null}
models:
- name: orders
columns:
- name: amount
config:
meta:
metrics:
total_revenue:
type: sum
spotlight:
segment_by:
- status
- customer_segment
filter_by:
- status
- region
default_segment: customer_segment
default_filter:
status: completed
```
```yaml dbt v1.9 and earlier theme={null}
models:
- name: orders
columns:
- name: amount
meta:
metrics:
total_revenue:
type: sum
spotlight:
segment_by:
- status
- customer_segment
filter_by:
- status
- region
default_segment: customer_segment
default_filter:
status: completed
```
```yaml Lightdash YAML theme={null}
type: model
name: orders
dimensions:
- name: amount
metrics:
total_revenue:
type: sum
sql: ${TABLE}.amount
spotlight:
segment_by:
- status
- customer_segment
filter_by:
- status
- region
default_segment: customer_segment
default_filter:
status: completed
```
Now when someone opens the `total_revenue` metric in the Metrics Explorer, it's segmented by `customer_segment` and filtered to completed orders right away.
`default_filter` uses the same syntax as [metric filters](/semantic-layer/metrics#available-filter-types), so you can express:
```yaml theme={null}
default_filter:
status: completed # is
```
```yaml theme={null}
default_filter:
status: [completed, shipped] # is one of
```
```yaml theme={null}
default_filter:
status: "!cancelled" # is not
```
* Defaults are just a starting point: users can change or remove them while exploring, and their choices always take precedence. The defaults re-apply the next time the metric is opened.
* `default_segment` must be a segmentable dimension (string or boolean) and, if you've set a `segment_by` allowlist, must be one of those dimensions.
* `default_filter` accepts a single dimension and, if you've set a `filter_by` allowlist, that dimension must be in it. Only the `is` and `is not` operators are supported.
### How it works
* **Dimension-level (boolean, default `true`)**: Controls whether a dimension appears in dropdowns for all metrics in that model.
* **Metric-level (array of dimension names)**: Creates an allowlist of dimensions for that specific metric.
* **Metric-level allowlists override dimension-level settings**: If a dimension has `filter_by: false` but a metric includes it in its `filter_by` array, it will still be available for that metric.
* **Defaults pre-select, allowlists restrict**: `default_segment` and `default_filter` choose the starting view, while `segment_by` and `filter_by` control what users can switch to.
### Use cases
* Hide internal/technical dimensions that aren't useful for analysis.
* Curate the exploration experience per metric (e.g., revenue metrics only filterable by business dimensions).
* Land users on the most useful view by default (e.g., revenue is always segmented by region, active users are always filtered to `status: active`).
* Reduce clutter in models with many dimensions.
## Configuring default time settings in .yml
We recommend setting up default time fields to make it easier for your business users and save them time.
To pre-select a time field in the explore view, simply define the default settings in your Lightdash `.yml` files.
### Set a table-level default time dimension
1. Create or modify your table configuration in the .yml file. For example, to set a default time dimension on the events table:
```yml dbt v1.10+ theme={null}
models:
- name: events
columns:
- name: event_date
description: "Event date"
config:
meta:
dimension:
label: "Event date"
type: date
time_intervals:
- DAY
- name: event
description: "Event"
config:
meta:
dimension:
type: string
metrics:
count:
type: count
```
```yml dbt v1.9 and earlier theme={null}
models:
- name: events
columns:
- name: event_date
description: "Event date"
meta:
dimension:
label: "Event date"
type: date
time_intervals:
- DAY
- name: event
description: "Event"
meta:
dimension:
type: string
metrics:
count:
type: count
```
```yml Lightdash YAML theme={null}
type: model
name: events
dimensions:
- name: event_date
description: "Event date"
label: "Event date"
type: date
time_intervals:
- DAY
- name: event
description: "Event"
type: string
metrics:
count:
type: count
sql: ${TABLE}.event
```
2. Add the default time dimension at the table level:
```yaml dbt v1.10+ theme={null}
models:
- name: events
config:
meta:
default_time_dimension:
field: event_date
interval: DAY
columns:
# ... your column definitions here
```
```yaml dbt v1.9 and earlier theme={null}
models:
- name: events
meta:
default_time_dimension:
field: event_date
interval: DAY
columns:
# ... your column definitions here
```
```yaml Lightdash YAML theme={null}
type: model
name: events
default_time_dimension:
field: event_date
interval: DAY
dimensions:
# ... your dimension definitions here
```
3. [Compile your project](/integrations/dbt/projects)
4. Navigate to the metrics catalog
5. Open any metrics from the events table
6. All metrics with that default time set will be plotted against the `event date` with day granularity `in the last 30 days`
### Set a metric-level default time dimension
This will override the time dimension defined on the table level.
1. Modify your existing table configuration to add a metric-level default time dimension:
```yaml dbt v1.10+ theme={null}
models:
- name: events
config:
meta:
default_time_dimension:
field: event_date
interval: DAY
columns:
- name: event
description: "Event"
config:
meta:
metrics:
count:
type: count
# This will override the table level default time dimension
default_time_dimension:
field: event_date
interval: MONTH
```
```yaml dbt v1.9 and earlier theme={null}
models:
- name: events
meta:
default_time_dimension:
field: event_date
interval: DAY
columns:
- name: event
description: "Event"
meta:
metrics:
count:
type: count
# This will override the table level default time dimension
default_time_dimension:
field: event_date
interval: MONTH
```
```yaml Lightdash YAML theme={null}
type: model
name: events
default_time_dimension:
field: event_date
interval: DAY
dimensions:
- name: event
description: "Event"
metrics:
count:
type: count
sql: ${TABLE}.event
# This will override the table level default time dimension
default_time_dimension:
field: event_date
interval: MONTH
```
2. [Compile your project](/integrations/dbt/projects)
3. Navigate to the metrics catalog
4. Explore the Events' count metric
5. The metric will be plotted against the `event date` with **month** granularity, instead of the default **day** granularity applied to the table
## FAQs
**a. What time intervals are supported?**
Currently, we only support: DAY, WEEK, MONTH, YEAR
**b. What pre-filled filters are applied?**
* Time grain Year -> past 3 years
* Time grain Month -> past 12 months
* Time grain Week -> past 12 weeks
* Time grain Day -> past 30 days
So if one of your business users explores a metric with a default time grain of DAY, metrics will be shown for the past 30 days with granularity of days with the default time dimension prefilled.
**c. Can I pull through other metadata from my .yml files?**
Not yet, but soon you'll be able to manage metadata directly in the UI and sync it back to dbt.
**d. Which other metrics can I compare my selected metric by?**
Currently, the "Compare to another metric" dropdown shows metrics **from the same table** as your selected metric that meet the following criteria:
1. **Metrics with defaults in `.yml`:** Metrics with a default time dimension specified in the `.yml` file will appear.
2. **Metrics with a single time dimension:** Metrics from tables with only one time dimension will appear as it's assumed to be the most relevant.
Cross-table metric comparison (including joined tables) is not yet supported. See [GitHub issue #21003](https://github.com/lightdash/lightdash/issues/21003) for updates.
**e. How can I be sure that my yml changes are correct?**
If you use VSCode, you can use our Lightdash schema validation to check your yml files are correct.
1. Install this YAML extension for VSCode: [https://marketplace.visualstudio.com/items?itemName=redhat.vscode-yaml](https://marketplace.visualstudio.com/items?itemName=redhat.vscode-yaml)
2. Open your user settings in JSON format and add the following:
```json theme={null}
"[yaml]": {
"editor.defaultFormatter": "redhat.vscode-yaml"
},
"yaml.schemas": {
"https://raw.githubusercontent.com/lightdash/lightdash/refs/heads/main/packages/common/src/schemas/json/lightdash-dbt-2.0.json": [
"*.yml",
"/**/models/**/*.yml",
"/**/models/**/*.yaml",
"!lightdash.config.yml",
"!dbt_project.yml"
],
"https://raw.githubusercontent.com/lightdash/lightdash/refs/heads/main/packages/common/src/schemas/json/lightdash-project-config-1.0.json": [
"lightdash.config.yml"
]
}
```
This will add schema validation to your model yml files and your lightdash.config.yml file.
3. Reload VSCode
4. You'll see a red squiggly line under any errors in your yml files as well as suggestions for how to fix them and what is allowed.
1. **Plot over time**: View your selected metric plotted over a time dimension as a line chart. You can adjust this dimension or set a default time dimension in your `.yml` to simplify the process for users. [See how](#configuring-default-time-settings-in-yml)
2. **Filter by date**: Use the date picker with convenient presets for quick selection. [See how default presets work based on the granularity](#faqs)
3. **Adjust the time granularity**: Refine your view by choosing the desired level of date granularity.
4. **Filter by a dimension:** Filter your metric by any string or boolean dimension from the same table.
5. **Segment-by**: Break down the metric by any non-time dimension in your dataset.
6. **Compare to:**
* **'This time last year'**: Compare the selected time period to the same period last year
* **'Another metric':** Compare to another metric **from the same table** that has a default time dimension specified in the `.yml`. [See how](#configuring-default-time-settings-in-yml)
Cross-table metric comparison (including joined tables) is not yet supported but is planned. See [GitHub issue #21003](https://github.com/lightdash/lightdash/issues/21003) for updates.
7. **Drag to zoom:** Click and drag across the chart to highlight the desired time range or data points, then release to zoom in on that segment. Hit 'Reset Zoom' to reset chart.
## Curating Metrics Catalog for your business users
Metrics Catalog is designed to be a tool for your business users to explore and understand your data.
To make Metrics Catalog more useful for your business users, you can curate the metrics they can see and explore.
To do this, you can:
* Control the visibility of metrics in the catalog
* Add categories to your metrics
* Add default time settings to your metrics
All through your Lightdash `.yml` files. Metrics curation is configured under the `spotlight` key — see [the `spotlight` config](/explore/metrics-catalog#the-spotlight-config) for an overview of what it covers.
### Configuring global visibility of metrics
You can control the visibility of metrics in the catalog by creating a new file called `lightdash.config.yml` in the root of your dbt project.
If you're new to lightdash.config.yml, check out our [getting started guide](/semantic-layer/lightdash-config-yml#getting-started) to learn how to create and set up this file.
See this video for an example on how to set this up:
**Step-by-step guide**
1. Add the following to your `lightdash.config.yml` file:
```yml theme={null}
spotlight:
default_visibility: show
```
**The default visibility can be set to `show` or `hide`.**
If you don't set this, the default visibility will be `show`, so all metrics will be visible in the catalog by default (but other settings like user attributes will still apply).
This will set the default visibility of metrics in the catalog to `show` for all metrics in your project. You can also set this to `hide` if you prefer to hide metrics by default and then override this on a per-model/metric basis.
2. Now that you've set the default visibility, you can override this on a per-model/metric basis.
```yml dbt v1.10+ theme={null}
models:
- name: events
config:
meta:
spotlight:
visibility: hide
```
```yml dbt v1.9 and earlier theme={null}
models:
- name: events
meta:
spotlight:
visibility: hide
```
```yml Lightdash YAML theme={null}
type: model
name: events
spotlight:
visibility: hide
```
This will hide the events model from the catalog.
3. If there are metrics in the events model that you want to make visible, you can override the default visibility for those metrics.
```yml dbt v1.10+ theme={null}
models:
- name: events
config:
meta:
spotlight:
visibility: hide
metrics:
event_count:
type: count
spotlight:
visibility: show
```
```yml dbt v1.9 and earlier theme={null}
models:
- name: events
meta:
spotlight:
visibility: hide
metrics:
event_count:
type: count
spotlight:
visibility: show
```
```yml Lightdash YAML theme={null}
type: model
name: events
spotlight:
visibility: hide
metrics:
event_count:
type: count
spotlight:
visibility: show
```
4. Once you compile your project, you'll see the `event_count` metric in the catalog, even though the events model is hidden.
### Assigning categories to metrics
Categories are a great way to organize your metrics in the catalog. You can create a new category by adding a new `categories` field to your `lightdash.config.yml` file.
Here's a video showing how to set this up:
**Step-by-step guide**
1. Add the following to your `lightdash.config.yml` file:
```yml theme={null}
spotlight:
categories:
revenue: # Required, this is the name of the category, and how it will be referenced in the catalog. It must be unique.
label: Revenue # Required, this is what will be displayed in the catalog
color: "orange" # Optional, defaults to "gray", with the option to choose from a range of colors: "gray", "violet", "red", "orange", "green", "blue", "indigo", "pink", "yellow"
```
2. Now that you've added a category, you can assign metrics to it by adding a `categories` field to your models `.yml` file.
```yml dbt v1.10+ theme={null}
models:
- name: events
config:
meta:
spotlight:
visibility: show
categories:
- revenue
```
```yml dbt v1.9 and earlier theme={null}
models:
- name: events
meta:
spotlight:
visibility: show
categories:
- revenue
```
```yml Lightdash YAML theme={null}
type: model
name: events
spotlight:
visibility: show
categories:
- revenue
```
This will add the `revenue` category to all metrics in the events model.
If you want to add another category to a specific metric, you can do so by adding the `categories` field to the metric's `.yml` file. And remember, you can only add categories that have been defined in the `lightdash.config.yml` file.
3. Now you can add the `marketing` category to the `event_count` metric:
So in your `lightdash.config.yml` file, you need to have another category. Let's call it `marketing` and add it to the `event_count` metric, like so:
```yml theme={null}
spotlight:
categories:
marketing:
label: Marketing
color: "blue"
revenue:
label: Revenue
color: "orange"
```
Now you can add the `marketing` category to the `event_count` metric:
```yml dbt v1.10+ theme={null}
models:
- name: events
config:
meta:
spotlight:
visibility: show
categories:
- revenue
metrics:
event_count:
type: count
spotlight:
categories:
- marketing
```
```yml dbt v1.9 and earlier theme={null}
models:
- name: events
meta:
spotlight:
visibility: show
categories:
- revenue
metrics:
event_count:
type: count
spotlight:
categories:
- marketing
```
```yml Lightdash YAML theme={null}
type: model
name: events
spotlight:
visibility: show
categories:
- revenue
metrics:
event_count:
type: count
spotlight:
categories:
- marketing
```
In this example, the `event_count` metric will have both the `marketing` and `revenue` categories, it's cumulative.
4. Once you compile your project, you'll see the `event_count` metric in the catalog with both the `marketing` and `revenue` categories and you can use this to filter your metrics in the catalog.
**The categories you define need to be unique, so you can't have two categories with the same name.**
If you try to add a category with the same name as an existing category, you'll get an error. This error will be displayed in the UI and in the terminal (if you use the Lightdash CLI) when you compile your project.
## Assigning owners to metrics
You can assign owners to metrics using the `spotlight.owner` property. The owner displays in the metrics catalog with their name and avatar.
### Set an owner at the metric level
```yaml dbt v1.10+ theme={null}
models:
- name: orders
columns:
- name: amount
config:
meta:
metrics:
total_revenue:
type: sum
spotlight:
owner: alice@yourcompany.com
```
```yaml dbt v1.9 and earlier theme={null}
models:
- name: orders
columns:
- name: amount
meta:
metrics:
total_revenue:
type: sum
spotlight:
owner: alice@yourcompany.com
```
```yaml Lightdash YAML theme={null}
type: model
name: orders
dimensions:
- name: amount
metrics:
total_revenue:
type: sum
sql: ${TABLE}.amount
spotlight:
owner: alice@yourcompany.com
```
### Set a default owner at the model level
You can set a default owner for all metrics in a model. Metric-level owners override the model-level default.
```yaml dbt v1.10+ theme={null}
models:
- name: orders
config:
meta:
spotlight:
owner: bob@yourcompany.com # default for all metrics in this model
columns:
- name: amount
config:
meta:
metrics:
total_revenue:
type: sum
spotlight:
owner: alice@yourcompany.com # overrides model owner
avg_revenue:
type: average
# inherits bob@yourcompany.com from model
```
```yaml dbt v1.9 and earlier theme={null}
models:
- name: orders
meta:
spotlight:
owner: bob@yourcompany.com # default for all metrics in this model
columns:
- name: amount
meta:
metrics:
total_revenue:
type: sum
spotlight:
owner: alice@yourcompany.com # overrides model owner
avg_revenue:
type: average
# inherits bob@yourcompany.com from model
```
```yaml Lightdash YAML theme={null}
type: model
name: orders
spotlight:
owner: bob@yourcompany.com # default for all metrics in this model
dimensions:
- name: amount
metrics:
total_revenue:
type: sum
sql: ${TABLE}.amount
spotlight:
owner: alice@yourcompany.com # overrides model owner
avg_revenue:
type: average
sql: ${TABLE}.amount
# inherits bob@yourcompany.com from model
```
* Use the email address of a Lightdash user in your organization.
* Metric-level owner takes precedence over model-level.
* You can filter by owner in the Metrics Catalog UI.
* If the email doesn't match a Lightdash user, the metric shows as "Unassigned".
## Controlling filtering and segmentation options
You can control which dimensions appear in the filter and segment-by dropdowns when exploring metrics. This helps users focus on relevant dimensions. You can also pre-apply a default segment and filter so users land on the most useful view as soon as they open a metric.
### Hide a dimension from all metrics
Use boolean values at the dimension level to hide a dimension from filter or segment-by dropdowns for all metrics in that model:
```yaml dbt v1.10+ theme={null}
models:
- name: orders
columns:
- name: internal_tracking_id
config:
meta:
dimension:
spotlight:
filter_by: false # hide from filter dropdown
segment_by: false # hide from segment-by dropdown
```
```yaml dbt v1.9 and earlier theme={null}
models:
- name: orders
columns:
- name: internal_tracking_id
meta:
dimension:
spotlight:
filter_by: false # hide from filter dropdown
segment_by: false # hide from segment-by dropdown
```
```yaml Lightdash YAML theme={null}
type: model
name: orders
dimensions:
- name: internal_tracking_id
spotlight:
filter_by: false # hide from filter dropdown
segment_by: false # hide from segment-by dropdown
```
### Allowlist specific dimensions for a metric
Use an array of dimension names at the metric level to create an allowlist of dimensions for that specific metric:
```yaml dbt v1.10+ theme={null}
models:
- name: orders
columns:
- name: amount
config:
meta:
metrics:
total_revenue:
type: sum
spotlight:
filter_by:
- status
- region
- order_date
segment_by:
- status
- customer_segment
```
```yaml dbt v1.9 and earlier theme={null}
models:
- name: orders
columns:
- name: amount
meta:
metrics:
total_revenue:
type: sum
spotlight:
filter_by:
- status
- region
- order_date
segment_by:
- status
- customer_segment
```
```yaml Lightdash YAML theme={null}
type: model
name: orders
dimensions:
- name: amount
metrics:
total_revenue:
type: sum
sql: ${TABLE}.amount
spotlight:
filter_by:
- status
- region
- order_date
segment_by:
- status
- customer_segment
```
### Set a default segment and filter for a metric
While `segment_by` and `filter_by` control which dimensions are *available*, `default_segment` and `default_filter` control which are *pre-selected* when a metric is opened. Use them when a metric is almost always viewed the same way (e.g., revenue segmented by region, or active users filtered to a specific status), so users don't have to set it up themselves every time.
```yaml dbt v1.10+ theme={null}
models:
- name: orders
columns:
- name: amount
config:
meta:
metrics:
total_revenue:
type: sum
spotlight:
segment_by:
- status
- customer_segment
filter_by:
- status
- region
default_segment: customer_segment
default_filter:
status: completed
```
```yaml dbt v1.9 and earlier theme={null}
models:
- name: orders
columns:
- name: amount
meta:
metrics:
total_revenue:
type: sum
spotlight:
segment_by:
- status
- customer_segment
filter_by:
- status
- region
default_segment: customer_segment
default_filter:
status: completed
```
```yaml Lightdash YAML theme={null}
type: model
name: orders
dimensions:
- name: amount
metrics:
total_revenue:
type: sum
sql: ${TABLE}.amount
spotlight:
segment_by:
- status
- customer_segment
filter_by:
- status
- region
default_segment: customer_segment
default_filter:
status: completed
```
Now when someone opens the `total_revenue` metric in the Metrics Explorer, it's segmented by `customer_segment` and filtered to completed orders right away.
`default_filter` uses the same syntax as [metric filters](/semantic-layer/metrics#available-filter-types), so you can express:
```yaml theme={null}
default_filter:
status: completed # is
```
```yaml theme={null}
default_filter:
status: [completed, shipped] # is one of
```
```yaml theme={null}
default_filter:
status: "!cancelled" # is not
```
* Defaults are just a starting point: users can change or remove them while exploring, and their choices always take precedence. The defaults re-apply the next time the metric is opened.
* `default_segment` must be a segmentable dimension (string or boolean) and, if you've set a `segment_by` allowlist, must be one of those dimensions.
* `default_filter` accepts a single dimension and, if you've set a `filter_by` allowlist, that dimension must be in it. Only the `is` and `is not` operators are supported.
### How it works
* **Dimension-level (boolean, default `true`)**: Controls whether a dimension appears in dropdowns for all metrics in that model.
* **Metric-level (array of dimension names)**: Creates an allowlist of dimensions for that specific metric.
* **Metric-level allowlists override dimension-level settings**: If a dimension has `filter_by: false` but a metric includes it in its `filter_by` array, it will still be available for that metric.
* **Defaults pre-select, allowlists restrict**: `default_segment` and `default_filter` choose the starting view, while `segment_by` and `filter_by` control what users can switch to.
### Use cases
* Hide internal/technical dimensions that aren't useful for analysis.
* Curate the exploration experience per metric (e.g., revenue metrics only filterable by business dimensions).
* Land users on the most useful view by default (e.g., revenue is always segmented by region, active users are always filtered to `status: active`).
* Reduce clutter in models with many dimensions.
## Configuring default time settings in .yml
We recommend setting up default time fields to make it easier for your business users and save them time.
To pre-select a time field in the explore view, simply define the default settings in your Lightdash `.yml` files.
### Set a table-level default time dimension
1. Create or modify your table configuration in the .yml file. For example, to set a default time dimension on the events table:
```yml dbt v1.10+ theme={null}
models:
- name: events
columns:
- name: event_date
description: "Event date"
config:
meta:
dimension:
label: "Event date"
type: date
time_intervals:
- DAY
- name: event
description: "Event"
config:
meta:
dimension:
type: string
metrics:
count:
type: count
```
```yml dbt v1.9 and earlier theme={null}
models:
- name: events
columns:
- name: event_date
description: "Event date"
meta:
dimension:
label: "Event date"
type: date
time_intervals:
- DAY
- name: event
description: "Event"
meta:
dimension:
type: string
metrics:
count:
type: count
```
```yml Lightdash YAML theme={null}
type: model
name: events
dimensions:
- name: event_date
description: "Event date"
label: "Event date"
type: date
time_intervals:
- DAY
- name: event
description: "Event"
type: string
metrics:
count:
type: count
sql: ${TABLE}.event
```
2. Add the default time dimension at the table level:
```yaml dbt v1.10+ theme={null}
models:
- name: events
config:
meta:
default_time_dimension:
field: event_date
interval: DAY
columns:
# ... your column definitions here
```
```yaml dbt v1.9 and earlier theme={null}
models:
- name: events
meta:
default_time_dimension:
field: event_date
interval: DAY
columns:
# ... your column definitions here
```
```yaml Lightdash YAML theme={null}
type: model
name: events
default_time_dimension:
field: event_date
interval: DAY
dimensions:
# ... your dimension definitions here
```
3. [Compile your project](/integrations/dbt/projects)
4. Navigate to the metrics catalog
5. Open any metrics from the events table
6. All metrics with that default time set will be plotted against the `event date` with day granularity `in the last 30 days`
### Set a metric-level default time dimension
This will override the time dimension defined on the table level.
1. Modify your existing table configuration to add a metric-level default time dimension:
```yaml dbt v1.10+ theme={null}
models:
- name: events
config:
meta:
default_time_dimension:
field: event_date
interval: DAY
columns:
- name: event
description: "Event"
config:
meta:
metrics:
count:
type: count
# This will override the table level default time dimension
default_time_dimension:
field: event_date
interval: MONTH
```
```yaml dbt v1.9 and earlier theme={null}
models:
- name: events
meta:
default_time_dimension:
field: event_date
interval: DAY
columns:
- name: event
description: "Event"
meta:
metrics:
count:
type: count
# This will override the table level default time dimension
default_time_dimension:
field: event_date
interval: MONTH
```
```yaml Lightdash YAML theme={null}
type: model
name: events
default_time_dimension:
field: event_date
interval: DAY
dimensions:
- name: event
description: "Event"
metrics:
count:
type: count
sql: ${TABLE}.event
# This will override the table level default time dimension
default_time_dimension:
field: event_date
interval: MONTH
```
2. [Compile your project](/integrations/dbt/projects)
3. Navigate to the metrics catalog
4. Explore the Events' count metric
5. The metric will be plotted against the `event date` with **month** granularity, instead of the default **day** granularity applied to the table
## FAQs
**a. What time intervals are supported?**
Currently, we only support: DAY, WEEK, MONTH, YEAR
**b. What pre-filled filters are applied?**
* Time grain Year -> past 3 years
* Time grain Month -> past 12 months
* Time grain Week -> past 12 weeks
* Time grain Day -> past 30 days
So if one of your business users explores a metric with a default time grain of DAY, metrics will be shown for the past 30 days with granularity of days with the default time dimension prefilled.
**c. Can I pull through other metadata from my .yml files?**
Not yet, but soon you'll be able to manage metadata directly in the UI and sync it back to dbt.
**d. Which other metrics can I compare my selected metric by?**
Currently, the "Compare to another metric" dropdown shows metrics **from the same table** as your selected metric that meet the following criteria:
1. **Metrics with defaults in `.yml`:** Metrics with a default time dimension specified in the `.yml` file will appear.
2. **Metrics with a single time dimension:** Metrics from tables with only one time dimension will appear as it's assumed to be the most relevant.
Cross-table metric comparison (including joined tables) is not yet supported. See [GitHub issue #21003](https://github.com/lightdash/lightdash/issues/21003) for updates.
**e. How can I be sure that my yml changes are correct?**
If you use VSCode, you can use our Lightdash schema validation to check your yml files are correct.
1. Install this YAML extension for VSCode: [https://marketplace.visualstudio.com/items?itemName=redhat.vscode-yaml](https://marketplace.visualstudio.com/items?itemName=redhat.vscode-yaml)
2. Open your user settings in JSON format and add the following:
```json theme={null}
"[yaml]": {
"editor.defaultFormatter": "redhat.vscode-yaml"
},
"yaml.schemas": {
"https://raw.githubusercontent.com/lightdash/lightdash/refs/heads/main/packages/common/src/schemas/json/lightdash-dbt-2.0.json": [
"*.yml",
"/**/models/**/*.yml",
"/**/models/**/*.yaml",
"!lightdash.config.yml",
"!dbt_project.yml"
],
"https://raw.githubusercontent.com/lightdash/lightdash/refs/heads/main/packages/common/src/schemas/json/lightdash-project-config-1.0.json": [
"lightdash.config.yml"
]
}
```
This will add schema validation to your model yml files and your lightdash.config.yml file.
3. Reload VSCode
4. You'll see a red squiggly line under any errors in your yml files as well as suggestions for how to fix them and what is allowed.
 ## Roles and permissions
| **Action** | **Project Admin** | **Project Developer** | **Project Editor** | **Project Interactive Viewer** | **Project Viewer** |
| :---------------------------- | :-------------------: | :-------------------: | :-------------------: | :-------------------------------------: | :-------------------------------------: |
| Browse the 'Metrics catalog' | | | | | |
| Add/edit /delete 'Categories' | | | | | |
| Open the 'Metrics Explorer' | | | | | |