> ## Documentation Index
> Fetch the complete documentation index at: https://docs.lightdash.com/llms.txt
> Use this file to discover all available pages before exploring further.
# Big value
> Use big value charts to display a single value prominently
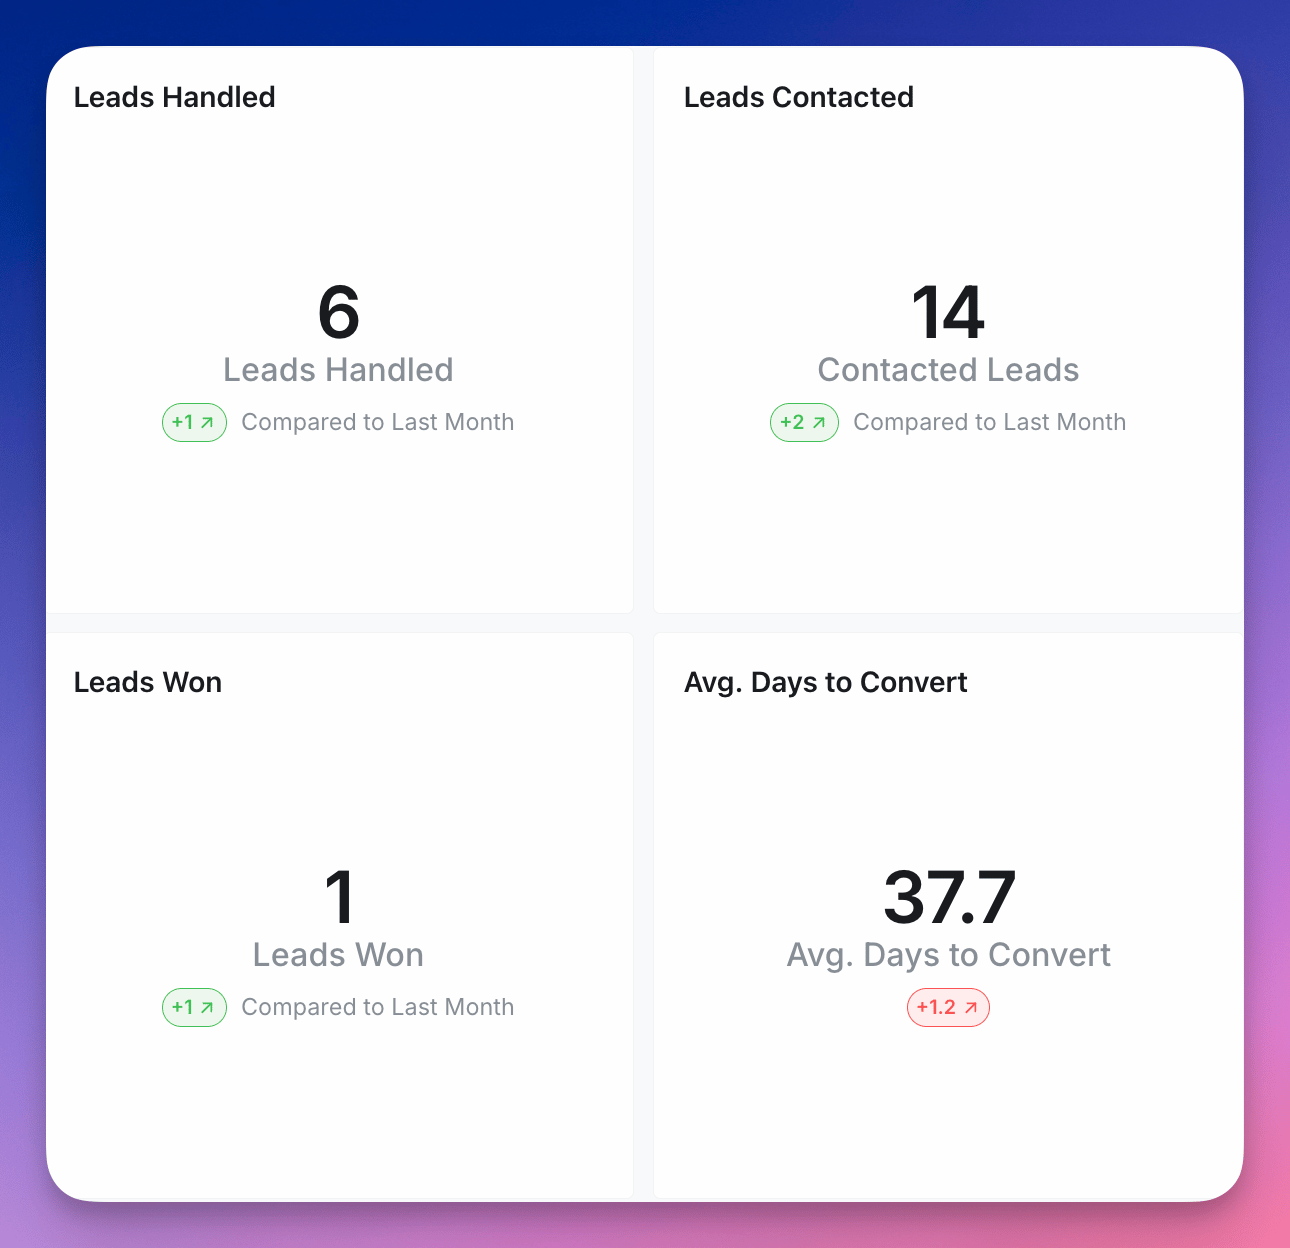 The Big value option is for displaying a single value, well, big.
The Big value works for any type of value: string, numeric, boolean, you name it! We always display the first value from the field in your results table.
The options for Big value include:
* Selecting which field you want to use for your Big value.
* Updating the label below the Big value value.
* Adding a comparison to the previous row
* Show raw value or percentage change
* Show red or green for positive or negative change
* Label your comparison value
* Adding conditional formatting rules to change the color of the big value based on conditions.
## Compact style
Numeric big values can be shortened using the **Compact** dropdown in the chart configuration panel. In addition to fixed styles (thousands, millions, billions, trillions), you can pick **Auto (K, M, B, T)** to let Lightdash choose the suffix based on the value's magnitude — so `1,500` renders as `1.50K` and `2,300,000` renders as `2.30M` without having to reconfigure the tile when the underlying value changes scale.
The Auto option is available for number and currency fields.
## Referencing the active granularity in labels
The label and comparison label accept the `${table_field.granularity}` placeholder to show the active date granularity — type `$` in the label field to pick from the available date dimensions. See [Referencing the granularity in chart labels](/explore/dashboards/date-zoom#referencing-the-granularity-in-chart-labels) for the full syntax and supported labels.
## Conditional formatting
You can apply conditional formatting to your big value to change its color based on specific conditions. To set up conditional formatting, go to the **Configure** tab, then select **Conditional formatting**.
### Adding a rule
Click the **+ Add** button to add a new rule. Each rule lets you:
1. Choose a color for light mode and dark mode separately.
2. Define one or more conditions that determine when the color is applied.
### Conditions
Each condition uses an operator and a value to compare against the big value. The available operators depend on the type of field you're displaying:
* **Numeric fields** support standard comparison operators (e.g., greater than, less than, equal to, between).
* **String dimensions** support `equals`, `not equals`, and `includes`.
You can add multiple conditions within a single rule. Multiple conditions within a rule are combined with **AND** logic, meaning all conditions must be met for the color to apply.
### Multiple rules
You can add multiple formatting rules. If two or more rules match, the rule that appears last in your list takes priority.
### Dark mode support
Each rule lets you set separate colors for light and dark mode, so your conditional formatting looks good regardless of which theme your viewers are using.
This documentation is built and hosted on [Mintlify](https://mintlify.com), a developer documentation platform.
The Big value option is for displaying a single value, well, big.
The Big value works for any type of value: string, numeric, boolean, you name it! We always display the first value from the field in your results table.
The options for Big value include:
* Selecting which field you want to use for your Big value.
* Updating the label below the Big value value.
* Adding a comparison to the previous row
* Show raw value or percentage change
* Show red or green for positive or negative change
* Label your comparison value
* Adding conditional formatting rules to change the color of the big value based on conditions.
## Compact style
Numeric big values can be shortened using the **Compact** dropdown in the chart configuration panel. In addition to fixed styles (thousands, millions, billions, trillions), you can pick **Auto (K, M, B, T)** to let Lightdash choose the suffix based on the value's magnitude — so `1,500` renders as `1.50K` and `2,300,000` renders as `2.30M` without having to reconfigure the tile when the underlying value changes scale.
The Auto option is available for number and currency fields.
## Referencing the active granularity in labels
The label and comparison label accept the `${table_field.granularity}` placeholder to show the active date granularity — type `$` in the label field to pick from the available date dimensions. See [Referencing the granularity in chart labels](/explore/dashboards/date-zoom#referencing-the-granularity-in-chart-labels) for the full syntax and supported labels.
## Conditional formatting
You can apply conditional formatting to your big value to change its color based on specific conditions. To set up conditional formatting, go to the **Configure** tab, then select **Conditional formatting**.
### Adding a rule
Click the **+ Add** button to add a new rule. Each rule lets you:
1. Choose a color for light mode and dark mode separately.
2. Define one or more conditions that determine when the color is applied.
### Conditions
Each condition uses an operator and a value to compare against the big value. The available operators depend on the type of field you're displaying:
* **Numeric fields** support standard comparison operators (e.g., greater than, less than, equal to, between).
* **String dimensions** support `equals`, `not equals`, and `includes`.
You can add multiple conditions within a single rule. Multiple conditions within a rule are combined with **AND** logic, meaning all conditions must be met for the color to apply.
### Multiple rules
You can add multiple formatting rules. If two or more rules match, the rule that appears last in your list takes priority.
### Dark mode support
Each rule lets you set separate colors for light and dark mode, so your conditional formatting looks good regardless of which theme your viewers are using.
This documentation is built and hosted on [Mintlify](https://mintlify.com), a developer documentation platform.