> ## Documentation Index
> Fetch the complete documentation index at: https://docs.lightdash.com/llms.txt
> Use this file to discover all available pages before exploring further.
# Map
> Use maps to display geographic data on an interactive map
Explore an interactive demo dashboard with scatter maps, area maps, and heatmaps.
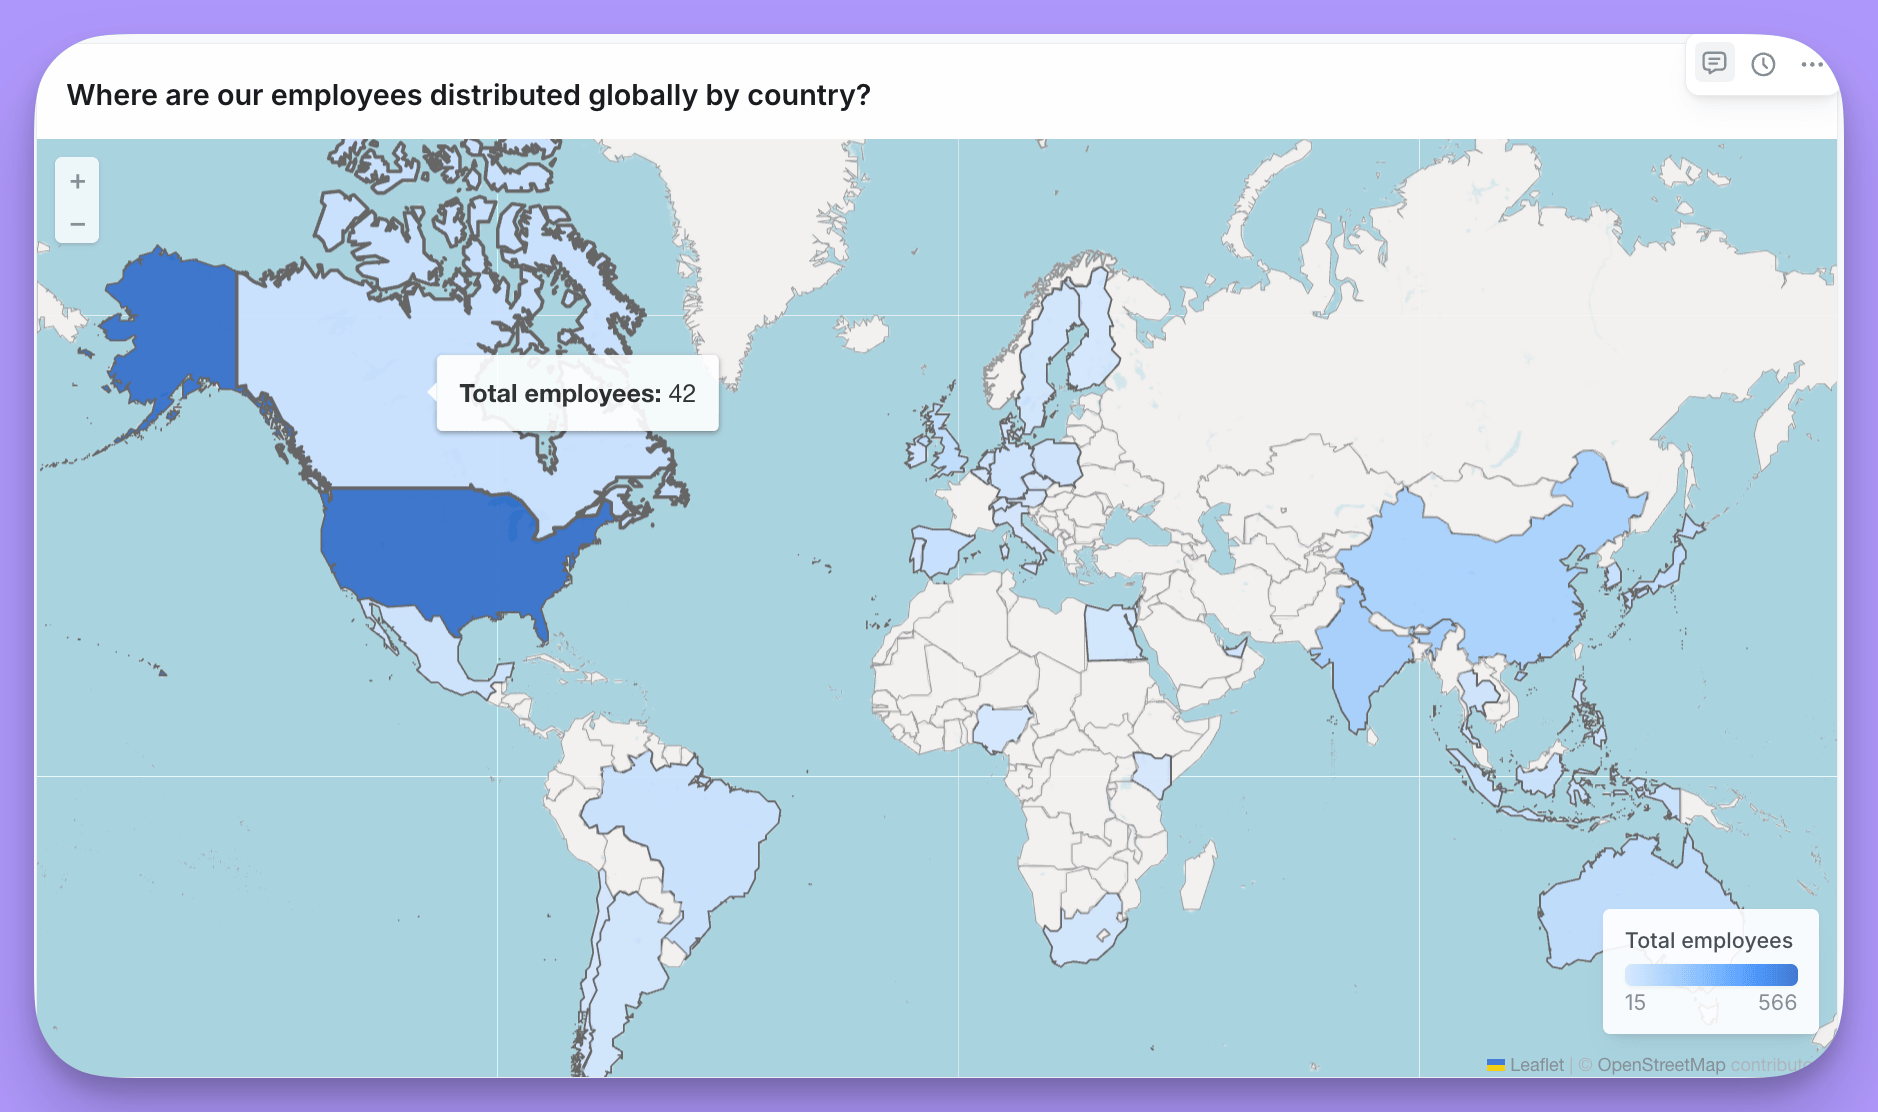 Maps display geographic data on an interactive map. They support three visualization modes:
* **Scatter** - Plot individual points using latitude/longitude coordinates
* **Area (Choropleth)** - Color regions based on values
* **Heatmap** - Show density of points as a heat overlay
Maps are useful when:
* Visualizing geographic distribution of data
* Showing regional performance or metrics
* Displaying location-based patterns
If a CARTO background displays an "API key required" watermark on a self-hosted instance, ask your administrator to [configure a CARTO Basemaps API key](/self-host/customize-deployment/environment-variables#map-basemaps).
## Scatter maps
Maps display geographic data on an interactive map. They support three visualization modes:
* **Scatter** - Plot individual points using latitude/longitude coordinates
* **Area (Choropleth)** - Color regions based on values
* **Heatmap** - Show density of points as a heat overlay
Maps are useful when:
* Visualizing geographic distribution of data
* Showing regional performance or metrics
* Displaying location-based patterns
If a CARTO background displays an "API key required" watermark on a self-hosted instance, ask your administrator to [configure a CARTO Basemaps API key](/self-host/customize-deployment/environment-variables#map-basemaps).
## Scatter maps
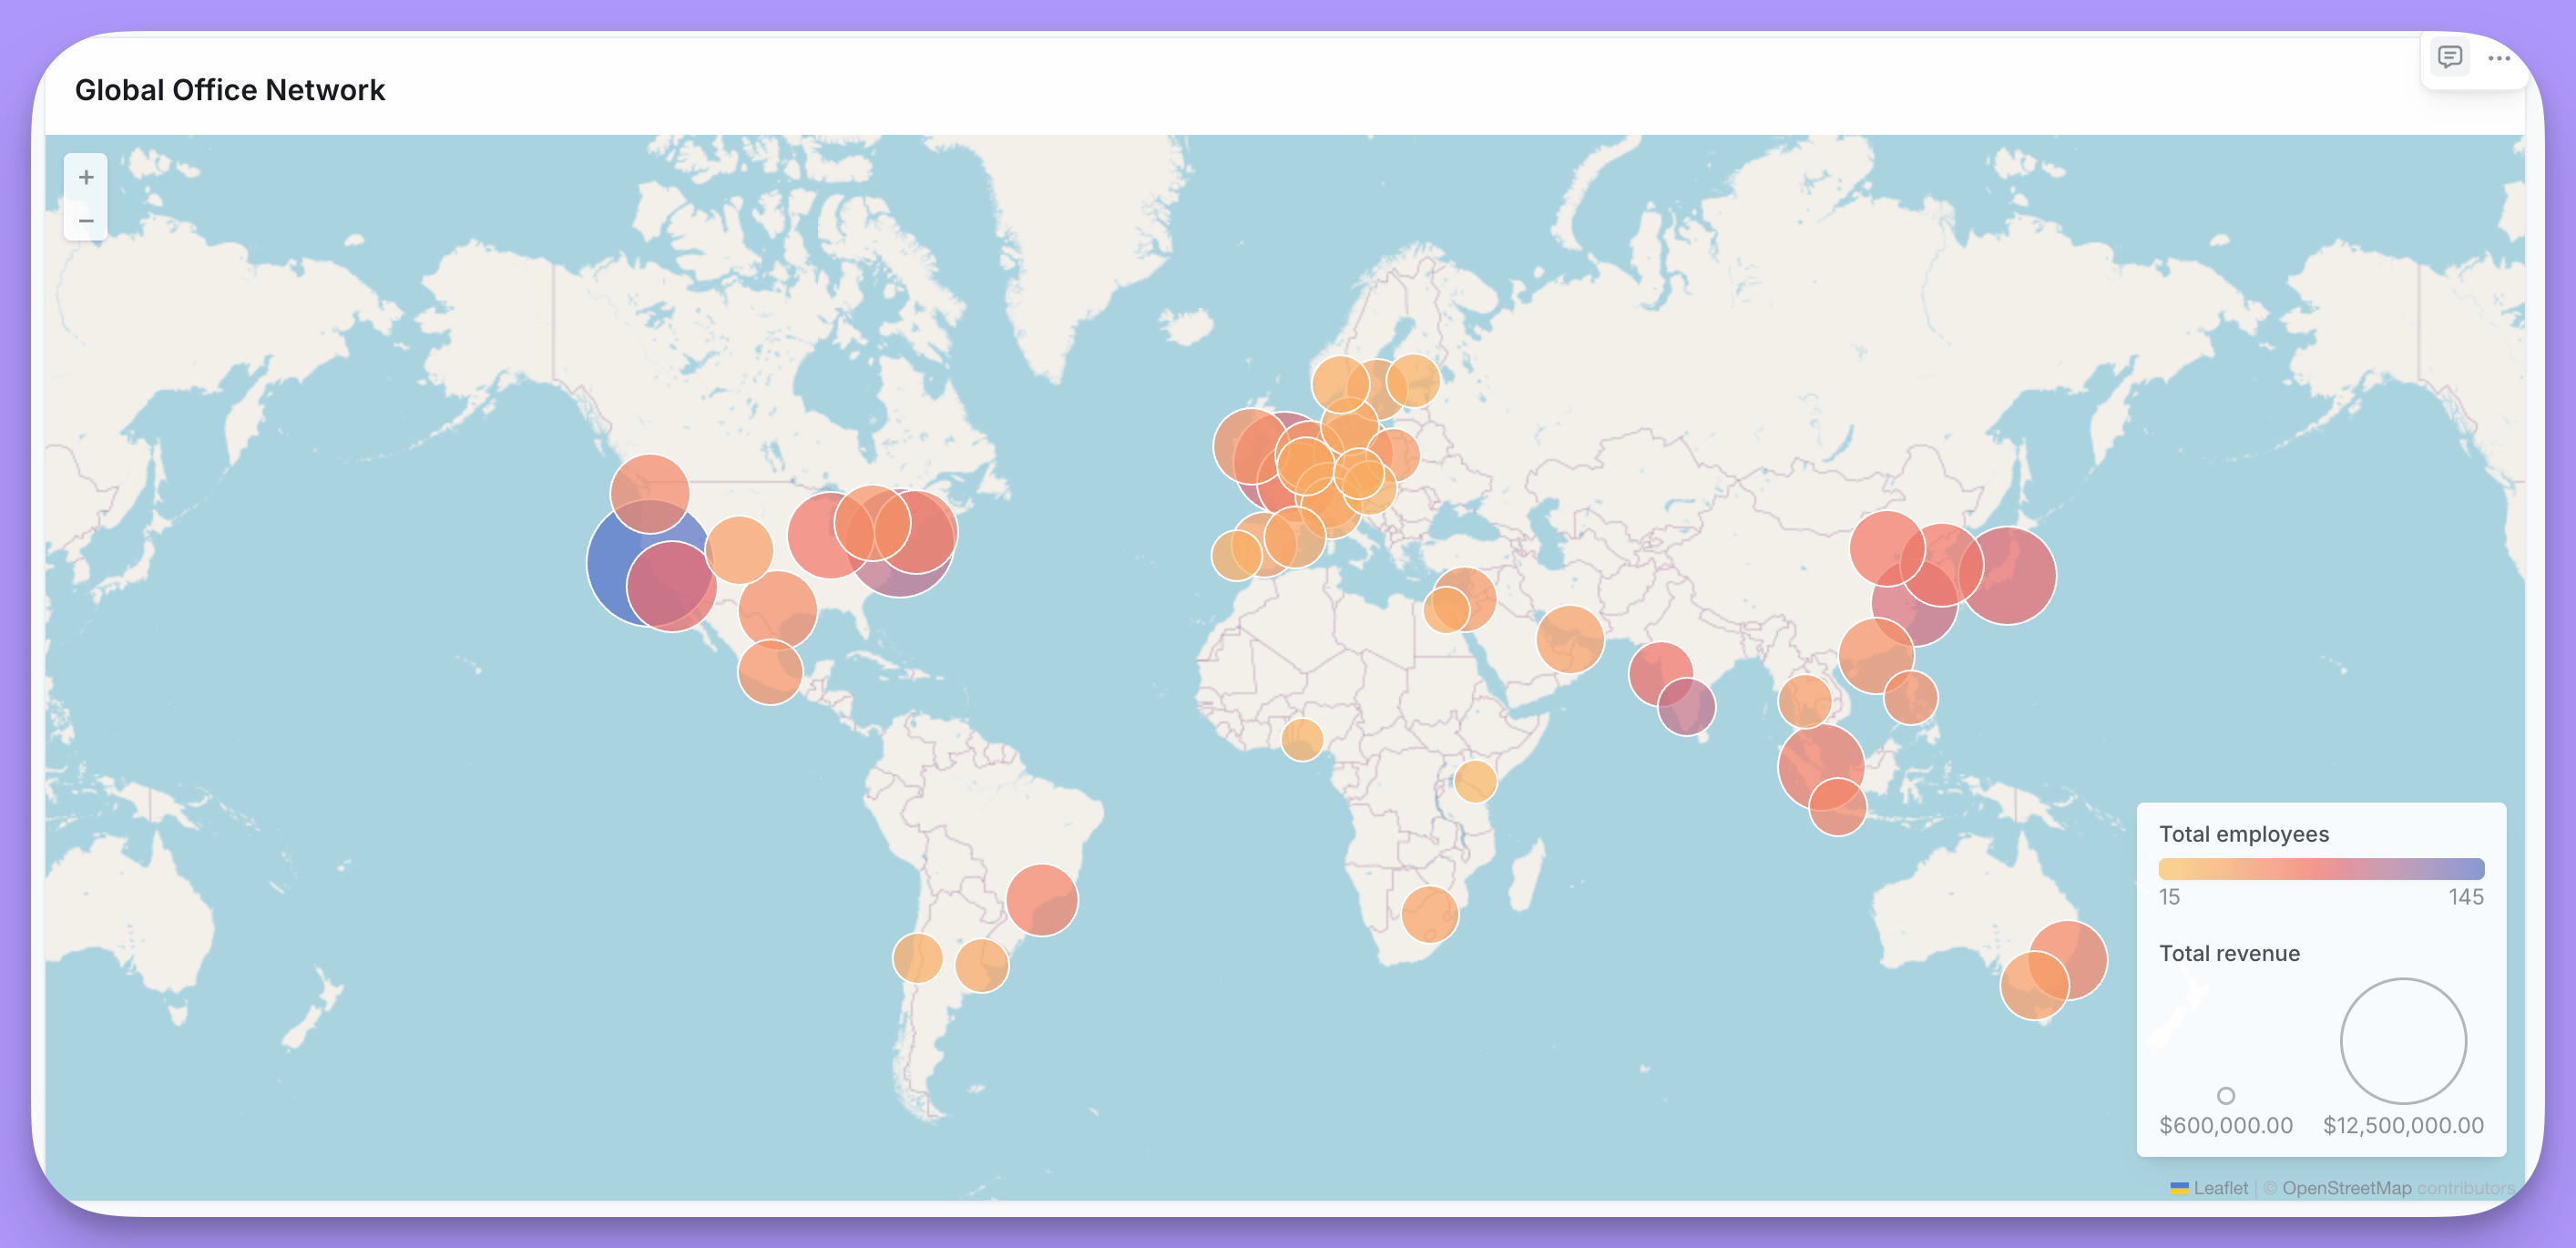 Scatter maps plot individual data points on a map using latitude and longitude coordinates. You can optionally size and color the points based on field values.
### Data requirements
Your data must include latitude and longitude coordinates. If your data contains addresses instead of coordinates, you'll need to geocode them to latitude/longitude values using a third-party geocoding service before using them in a map.
### Layout options
| Option | Description |
| - | - |
| Latitude field | Field containing latitude coordinates. |
| Longitude field | Field containing longitude coordinates. |
### Display options
| Option | Description |
| - | - |
| Color based on | Field to determine point color. When set to a numeric field, displays a color gradient. |
| Color / Color range | Single color when no color field is selected, or gradient colors (2-5 colors) for numeric fields. |
| Size based on | Field to determine bubble size (optional). |
| Size / Size range | Fixed size when no size field is selected, or min/max range when sizing by a field. |
| Show legend | Toggle legend visibility. |
| Background map | None, OpenStreetMap, Light, Dark, Voyager (clean), or Satellite. Choose separate backgrounds for light and dark mode. When set to None, you can set a custom background color. |
| Save current map extent | Preserves zoom and pan position when enabled. |
## Area maps (Choropleth)
Scatter maps plot individual data points on a map using latitude and longitude coordinates. You can optionally size and color the points based on field values.
### Data requirements
Your data must include latitude and longitude coordinates. If your data contains addresses instead of coordinates, you'll need to geocode them to latitude/longitude values using a third-party geocoding service before using them in a map.
### Layout options
| Option | Description |
| - | - |
| Latitude field | Field containing latitude coordinates. |
| Longitude field | Field containing longitude coordinates. |
### Display options
| Option | Description |
| - | - |
| Color based on | Field to determine point color. When set to a numeric field, displays a color gradient. |
| Color / Color range | Single color when no color field is selected, or gradient colors (2-5 colors) for numeric fields. |
| Size based on | Field to determine bubble size (optional). |
| Size / Size range | Fixed size when no size field is selected, or min/max range when sizing by a field. |
| Show legend | Toggle legend visibility. |
| Background map | None, OpenStreetMap, Light, Dark, Voyager (clean), or Satellite. Choose separate backgrounds for light and dark mode. When set to None, you can set a custom background color. |
| Save current map extent | Preserves zoom and pan position when enabled. |
## Area maps (Choropleth)
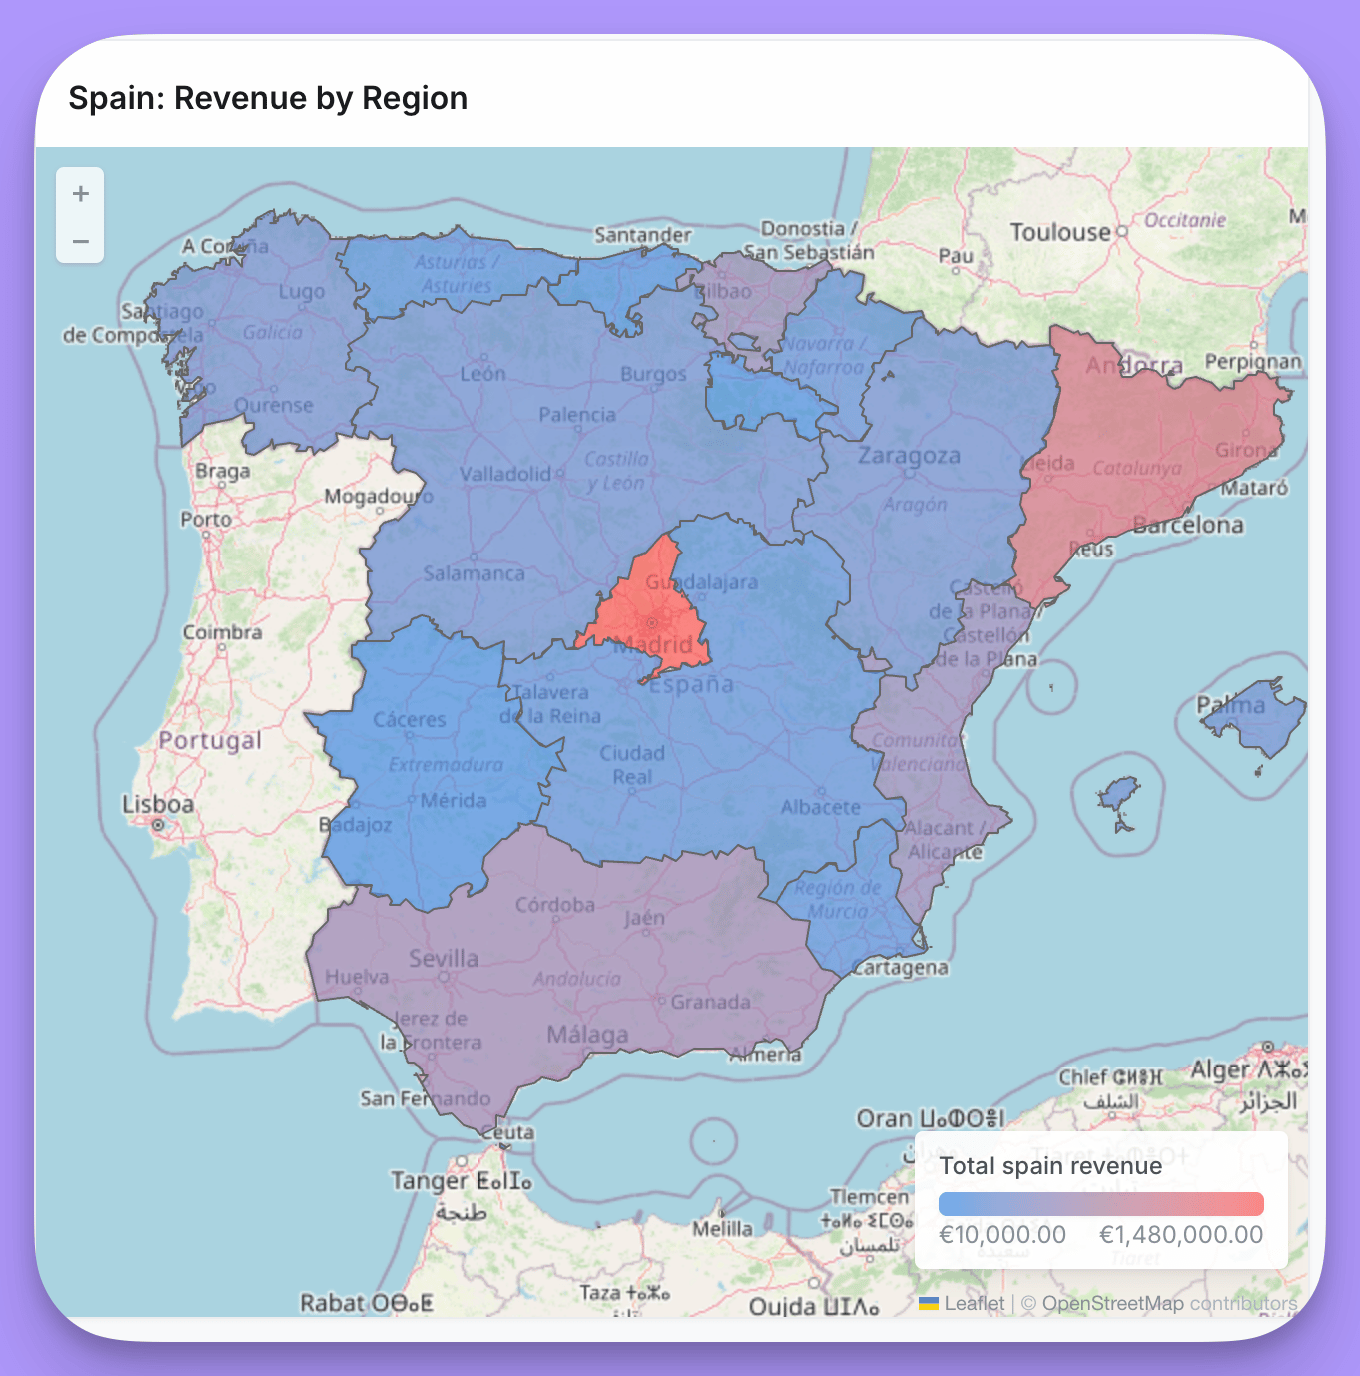 Area maps color geographic regions based on data values. You can use built-in region shapes for countries or US states, or provide custom GeoJSON for other boundaries.
### Data requirements
* **Country codes** - ISO 3166-1 alpha-3 codes (e.g., "USA", "GBR") for world maps
* **US state codes** - State abbreviations (e.g., "CA", "NY") for US maps
* **Custom identifiers** - Any identifier that matches a property in your custom GeoJSON file
### Layout options
| Option | Description |
| - | - |
| Custom region | Toggle to use a custom GeoJSON file instead of built-in regions. |
| Map region | World or US (when custom region is off). |
| Custom GeoJSON URL | URL to your GeoJSON file (when custom region is on). |
| Map join field | Property from the GeoJSON file to join on (when custom region is on). |
| Data join field | Field in your data containing values that match the map join field. Label changes based on map type: "Country code field (ISO3)" for world, "State field" for US. |
#### Using custom GeoJSON
When you enable **Custom region**, you can provide a URL to any GeoJSON file that defines your region boundaries. After entering the URL, Lightdash loads the available properties from the GeoJSON and displays them in the **Map join field** dropdown. Select the property that contains values matching your data.
For example, if your GeoJSON has a `postal_code` property and your data has a `zip_code` field:
1. Enable **Custom region** and enter your GeoJSON URL
2. Select `postal_code` from the **Map join field** dropdown
3. Select your `zip_code` field as the **Data join field**
##### Custom GeoJSON URL requirements
Lightdash fetches custom GeoJSON files through a server-side proxy that enforces the following requirements:
* The URL must use **HTTPS**.
* The file path must end in `.json`, `.geojson`, or `.topojson`.
* The file must be **10 MB or smaller** and the host must respond within **30 seconds**.
* The host must be a public address. URLs that resolve to private, loopback, link-local, multicast, or carrier-grade NAT IP ranges are rejected.
* **Redirects are not followed.** Host your file at a stable URL that responds with `200 OK` directly.
If a URL fails these checks, the **Map join field** dropdown stays empty and the chart shows an error. Re-upload the file to a public HTTPS host (for example, a CDN or object storage bucket with public read access) and try again.
### Display options
| Option | Description |
| - | - |
| Color based on | Field to determine region color intensity. |
| Color range | Gradient colors (2-5 colors) from low to high values. |
| No data color | Color for regions that have no matching data. |
| Show legend | Toggle legend visibility. |
| Background map | None, OpenStreetMap, Light, Dark, Voyager (clean), or Satellite. Choose separate backgrounds for light and dark mode. When set to None, you can set a custom background color. |
| Save current map extent | Preserves zoom and pan position when enabled. |
## Heatmaps
Area maps color geographic regions based on data values. You can use built-in region shapes for countries or US states, or provide custom GeoJSON for other boundaries.
### Data requirements
* **Country codes** - ISO 3166-1 alpha-3 codes (e.g., "USA", "GBR") for world maps
* **US state codes** - State abbreviations (e.g., "CA", "NY") for US maps
* **Custom identifiers** - Any identifier that matches a property in your custom GeoJSON file
### Layout options
| Option | Description |
| - | - |
| Custom region | Toggle to use a custom GeoJSON file instead of built-in regions. |
| Map region | World or US (when custom region is off). |
| Custom GeoJSON URL | URL to your GeoJSON file (when custom region is on). |
| Map join field | Property from the GeoJSON file to join on (when custom region is on). |
| Data join field | Field in your data containing values that match the map join field. Label changes based on map type: "Country code field (ISO3)" for world, "State field" for US. |
#### Using custom GeoJSON
When you enable **Custom region**, you can provide a URL to any GeoJSON file that defines your region boundaries. After entering the URL, Lightdash loads the available properties from the GeoJSON and displays them in the **Map join field** dropdown. Select the property that contains values matching your data.
For example, if your GeoJSON has a `postal_code` property and your data has a `zip_code` field:
1. Enable **Custom region** and enter your GeoJSON URL
2. Select `postal_code` from the **Map join field** dropdown
3. Select your `zip_code` field as the **Data join field**
##### Custom GeoJSON URL requirements
Lightdash fetches custom GeoJSON files through a server-side proxy that enforces the following requirements:
* The URL must use **HTTPS**.
* The file path must end in `.json`, `.geojson`, or `.topojson`.
* The file must be **10 MB or smaller** and the host must respond within **30 seconds**.
* The host must be a public address. URLs that resolve to private, loopback, link-local, multicast, or carrier-grade NAT IP ranges are rejected.
* **Redirects are not followed.** Host your file at a stable URL that responds with `200 OK` directly.
If a URL fails these checks, the **Map join field** dropdown stays empty and the chart shows an error. Re-upload the file to a public HTTPS host (for example, a CDN or object storage bucket with public read access) and try again.
### Display options
| Option | Description |
| - | - |
| Color based on | Field to determine region color intensity. |
| Color range | Gradient colors (2-5 colors) from low to high values. |
| No data color | Color for regions that have no matching data. |
| Show legend | Toggle legend visibility. |
| Background map | None, OpenStreetMap, Light, Dark, Voyager (clean), or Satellite. Choose separate backgrounds for light and dark mode. When set to None, you can set a custom background color. |
| Save current map extent | Preserves zoom and pan position when enabled. |
## Heatmaps
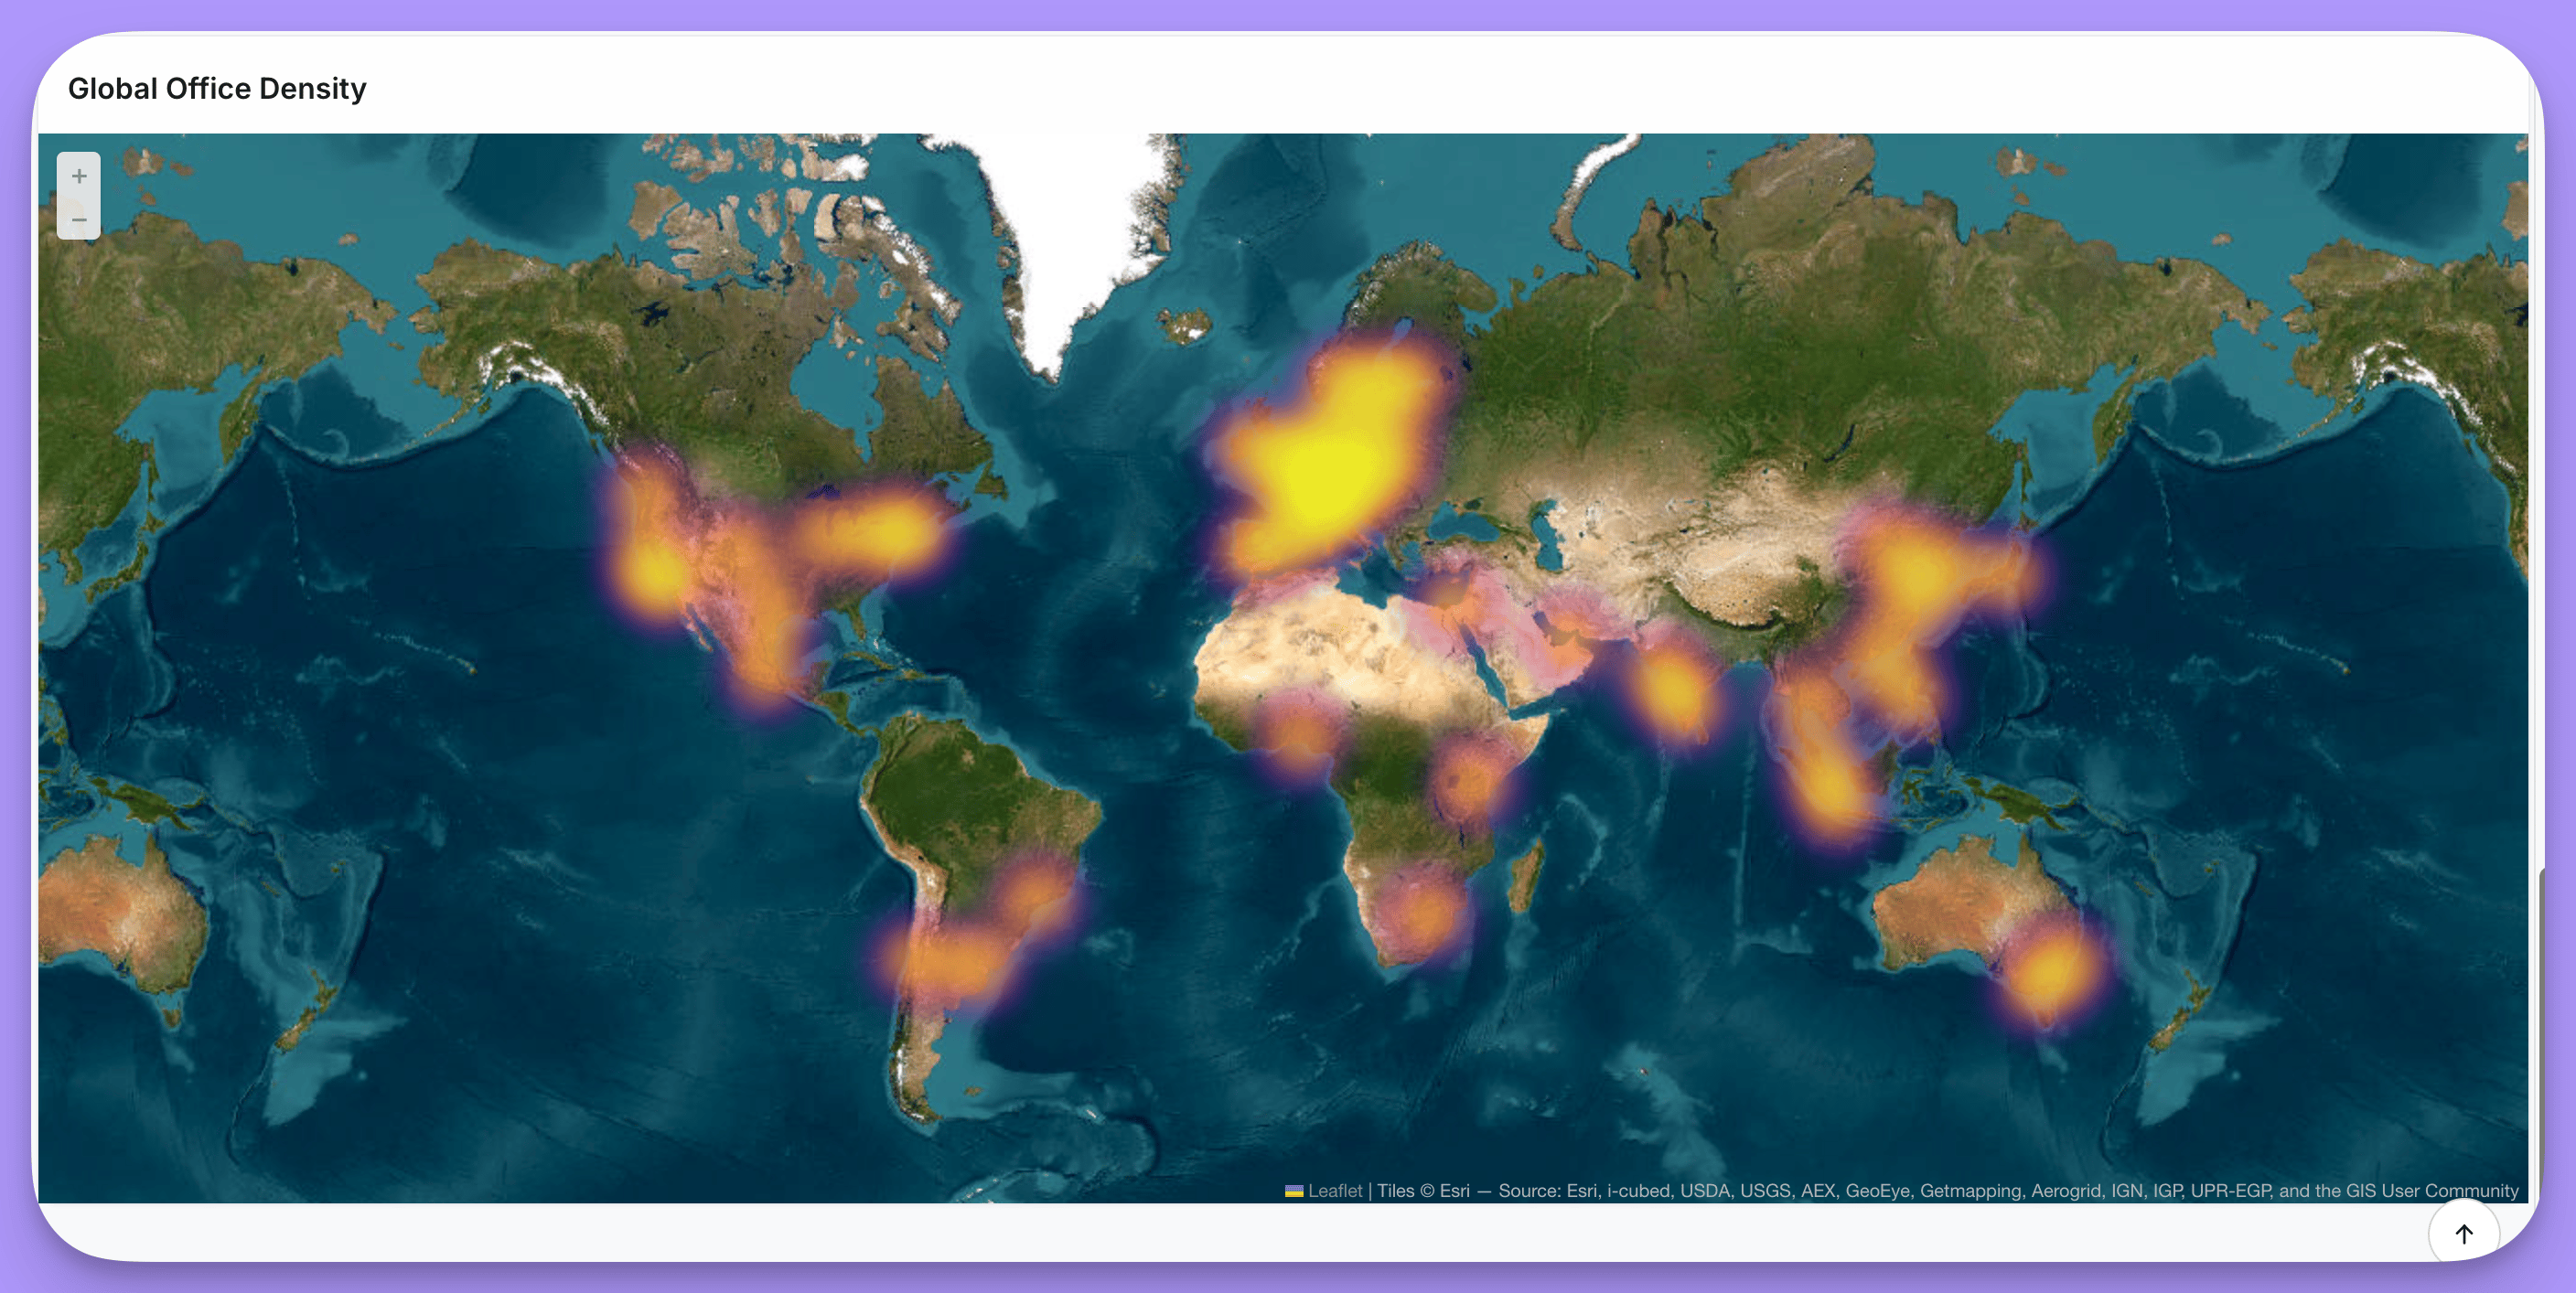 Heatmaps show the density of points as a heat overlay, useful for visualizing concentration of data points across geographic areas.
### Data requirements
Your data must include latitude and longitude coordinates. If your data contains addresses instead of coordinates, you'll need to geocode them to latitude/longitude values using a third-party geocoding service before using them in a map.
### Layout options
| Option | Description |
| - | - |
| Latitude field | Field containing latitude coordinates. |
| Longitude field | Field containing longitude coordinates. |
### Display options
| Option | Description |
| - | - |
| Color range | Gradient colors (2-5 colors) from low to high density. |
| Radius | Size of each heat point (1-50). |
| Blur | Amount of blur applied to heat points (0-30). |
| Opacity | Transparency of the heatmap overlay (0.1-1). |
| Show legend | Toggle legend visibility. |
| Background map | None, OpenStreetMap, Light, Dark, Voyager (clean), or Satellite. Choose separate backgrounds for light and dark mode. When set to None, you can set a custom background color. |
| Save current map extent | Preserves zoom and pan position when enabled. |
This documentation is built and hosted on [Mintlify](https://mintlify.com), a developer documentation platform.
Heatmaps show the density of points as a heat overlay, useful for visualizing concentration of data points across geographic areas.
### Data requirements
Your data must include latitude and longitude coordinates. If your data contains addresses instead of coordinates, you'll need to geocode them to latitude/longitude values using a third-party geocoding service before using them in a map.
### Layout options
| Option | Description |
| - | - |
| Latitude field | Field containing latitude coordinates. |
| Longitude field | Field containing longitude coordinates. |
### Display options
| Option | Description |
| - | - |
| Color range | Gradient colors (2-5 colors) from low to high density. |
| Radius | Size of each heat point (1-50). |
| Blur | Amount of blur applied to heat points (0-30). |
| Opacity | Transparency of the heatmap overlay (0.1-1). |
| Show legend | Toggle legend visibility. |
| Background map | None, OpenStreetMap, Light, Dark, Voyager (clean), or Satellite. Choose separate backgrounds for light and dark mode. When set to None, you can set a custom background color. |
| Save current map extent | Preserves zoom and pan position when enabled. |
This documentation is built and hosted on [Mintlify](https://mintlify.com), a developer documentation platform.