

Project chart types are an enterprise feature and require the data apps runtime to be enabled.
Browsing chart types
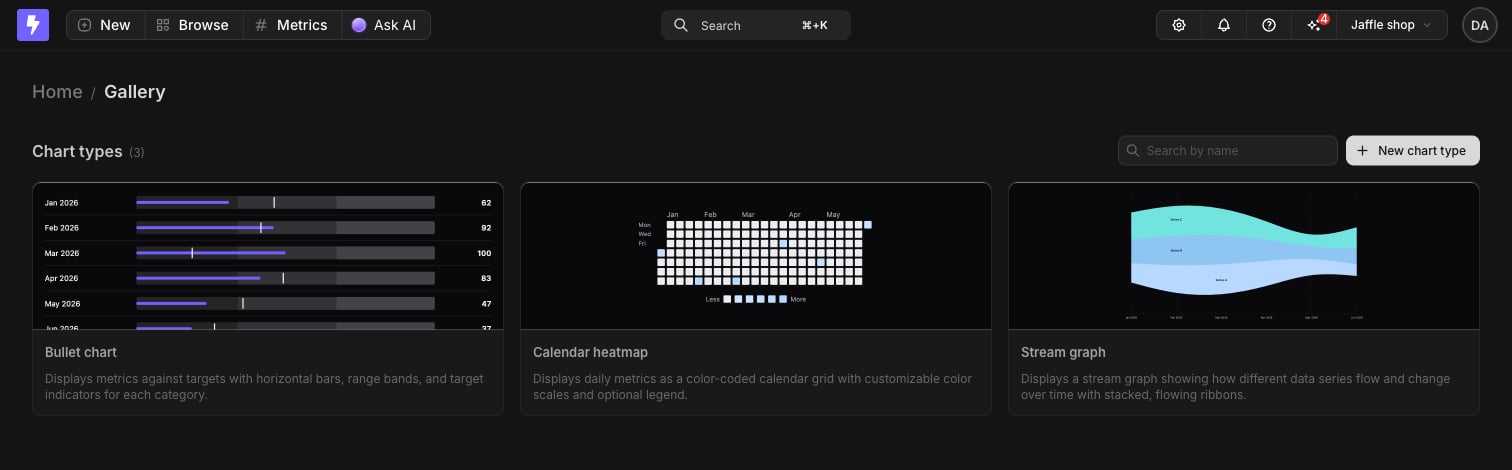
Every chart type in the project lives in the gallery. Go to Browse and pick Chart types. Each card previews the chart type with sample data. Click a card to see its description, who built it, its inputs, and its current version, and to preview it in the Explorer, edit it, or delete it.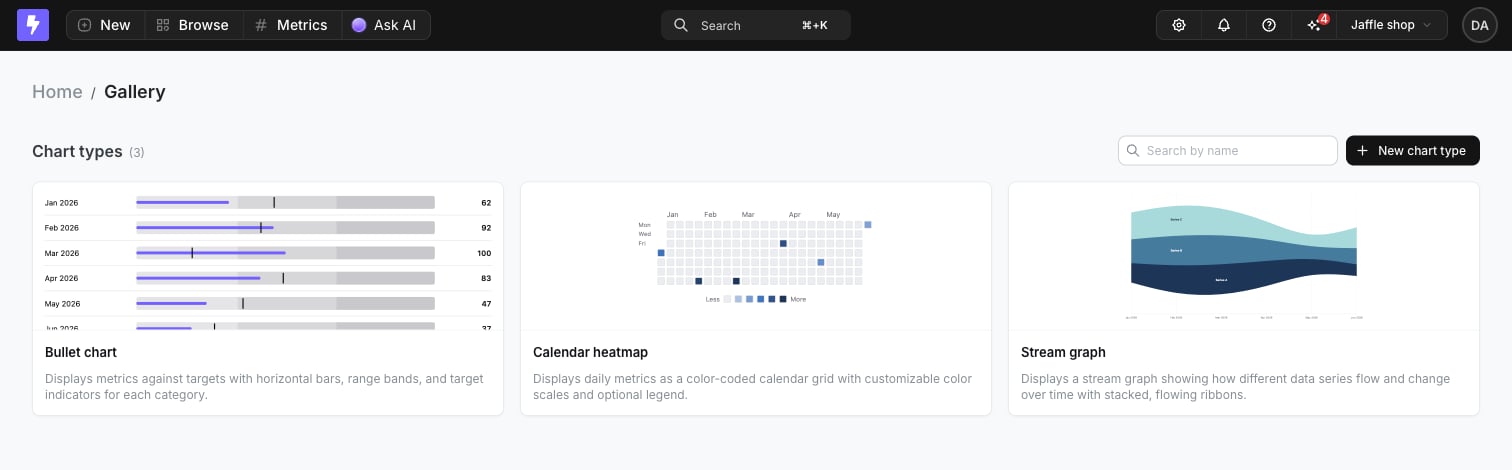
Building a chart type
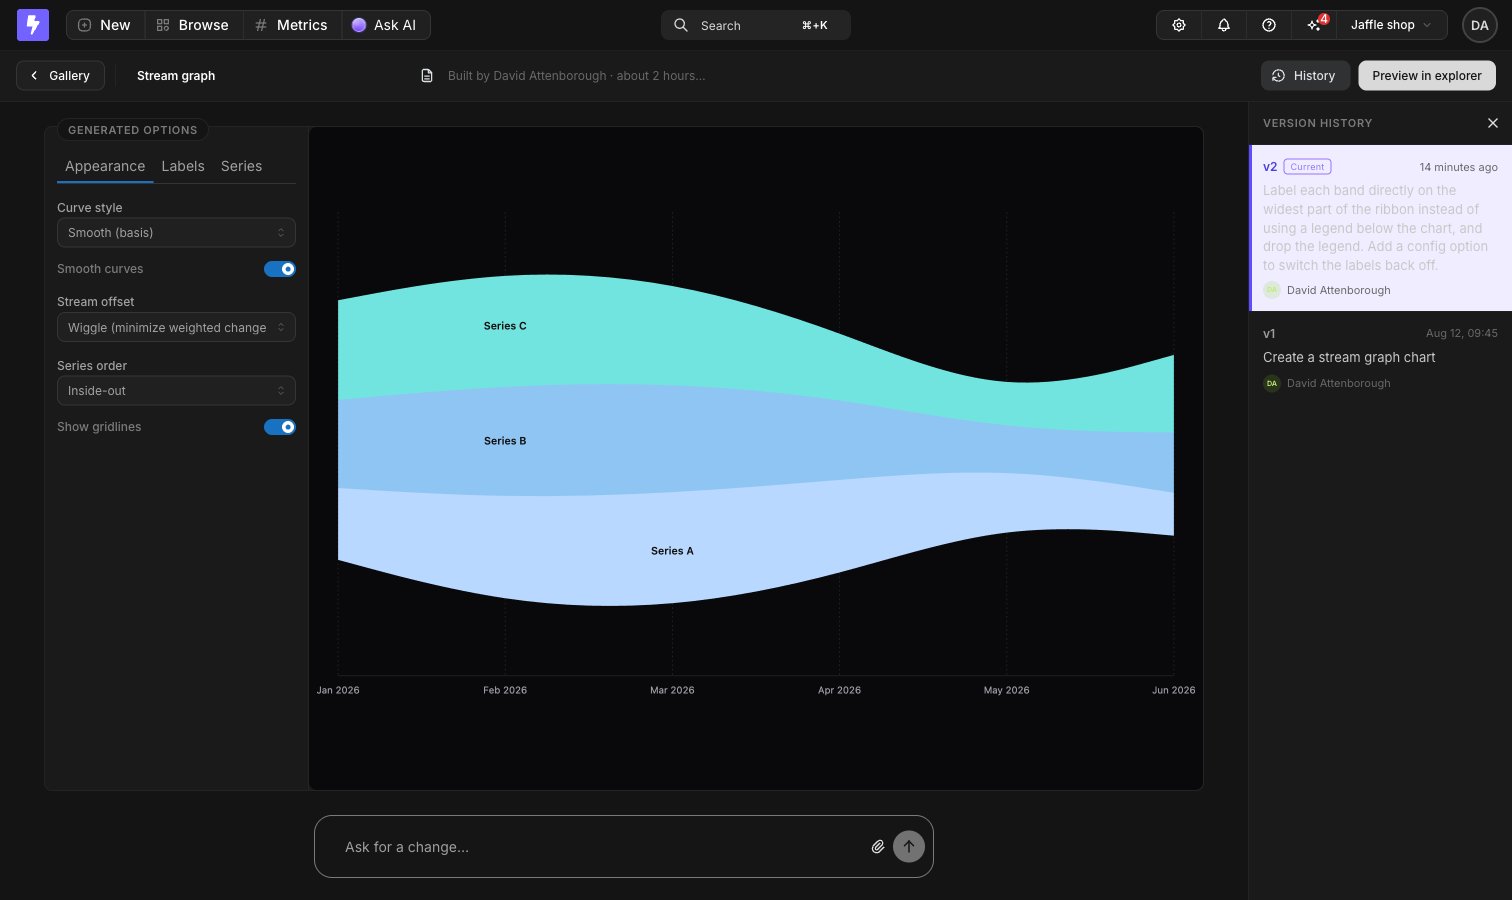
Click New chart type in the gallery to open the builder, then describe the chart you want. The builder previews the chart type with sample data as it’s built. The Configure panel beside the preview holds the display options the chart type declares, along with a color palette to preview it against. Follow-up prompts create new versions, and History opens a panel where you can view an earlier version or restore it. Name and describe the chart type in the header - that’s what people see in the gallery and in the chart type picker. When it looks right, click Preview in explorer to try it against a real query.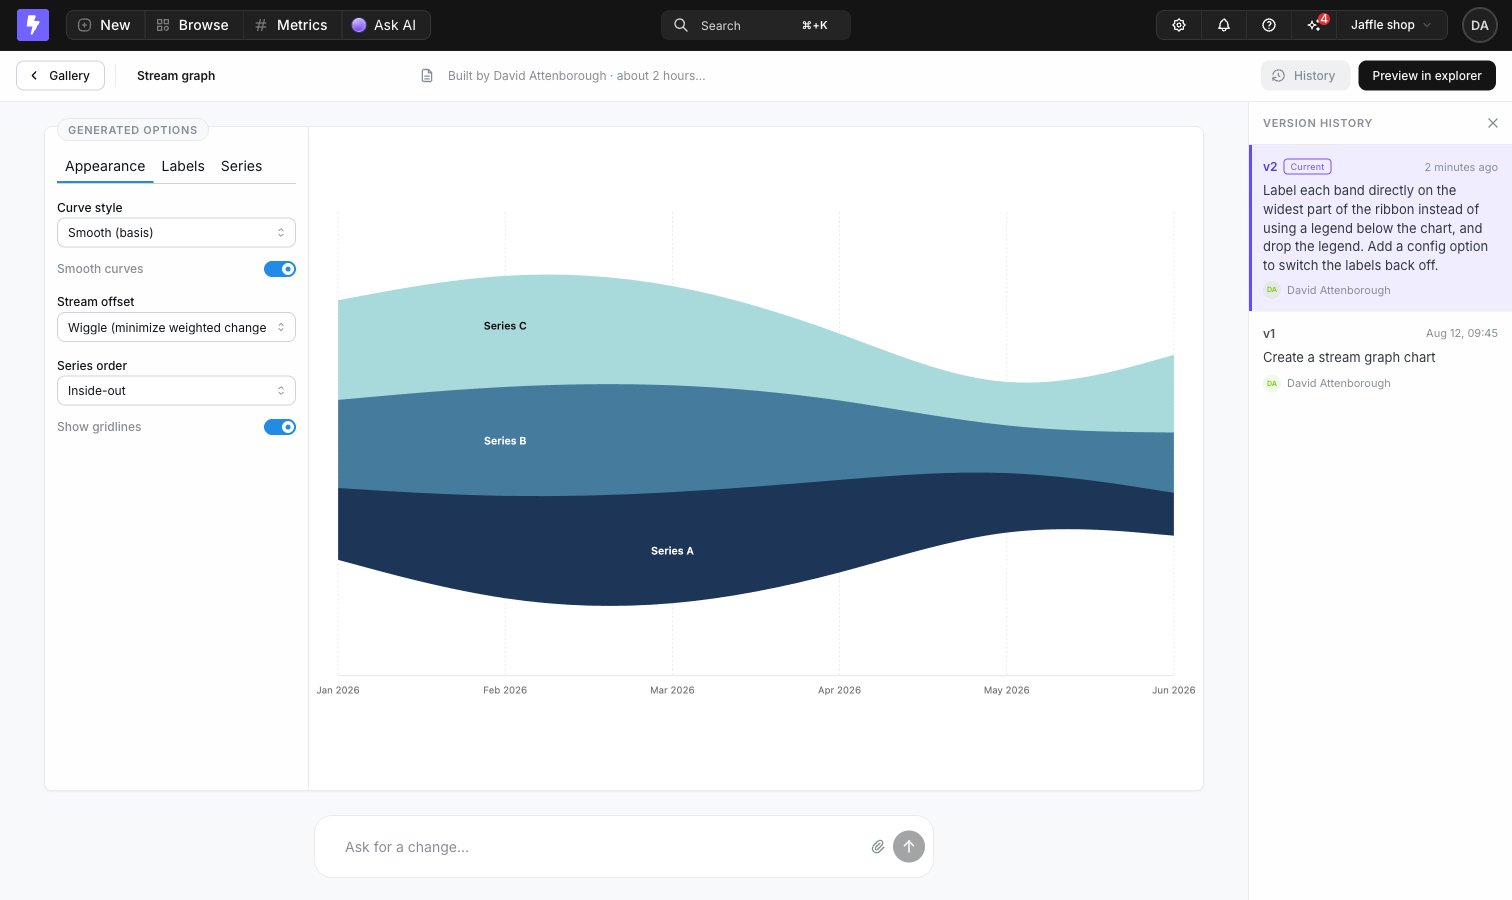
Using a chart type in a chart
1
Run your query
Select the dimensions and metrics your chart needs and run the query. You have to run it before you can pick a custom chart type.
2
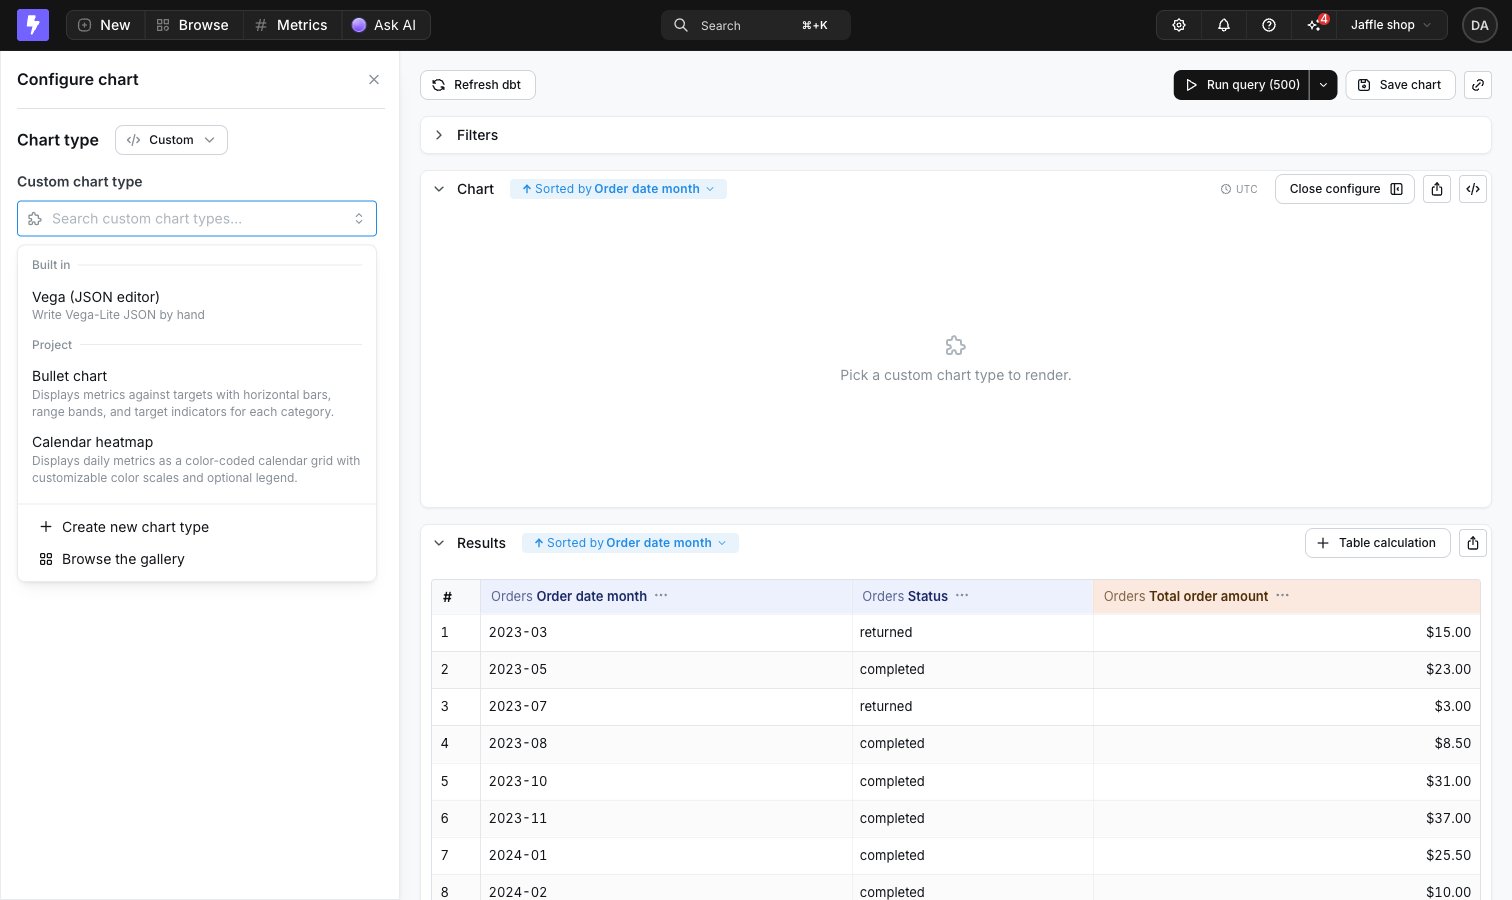
Pick the chart type
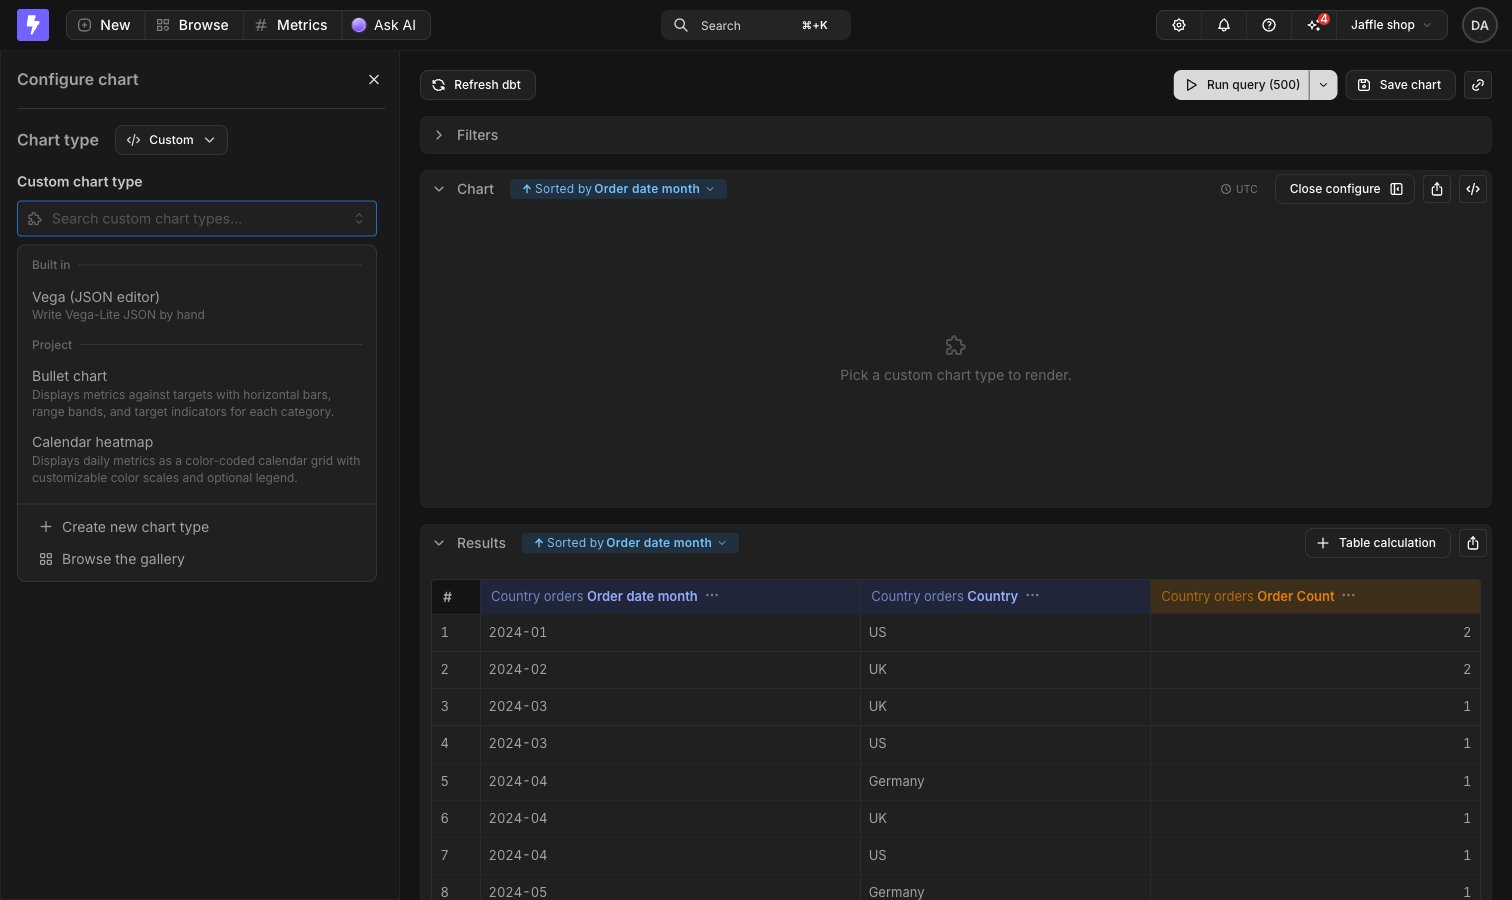
Open Configure, choose Custom in the chart type menu, then pick one from the Project group in the Custom chart type picker. Only chart types that finished building are listed.
3
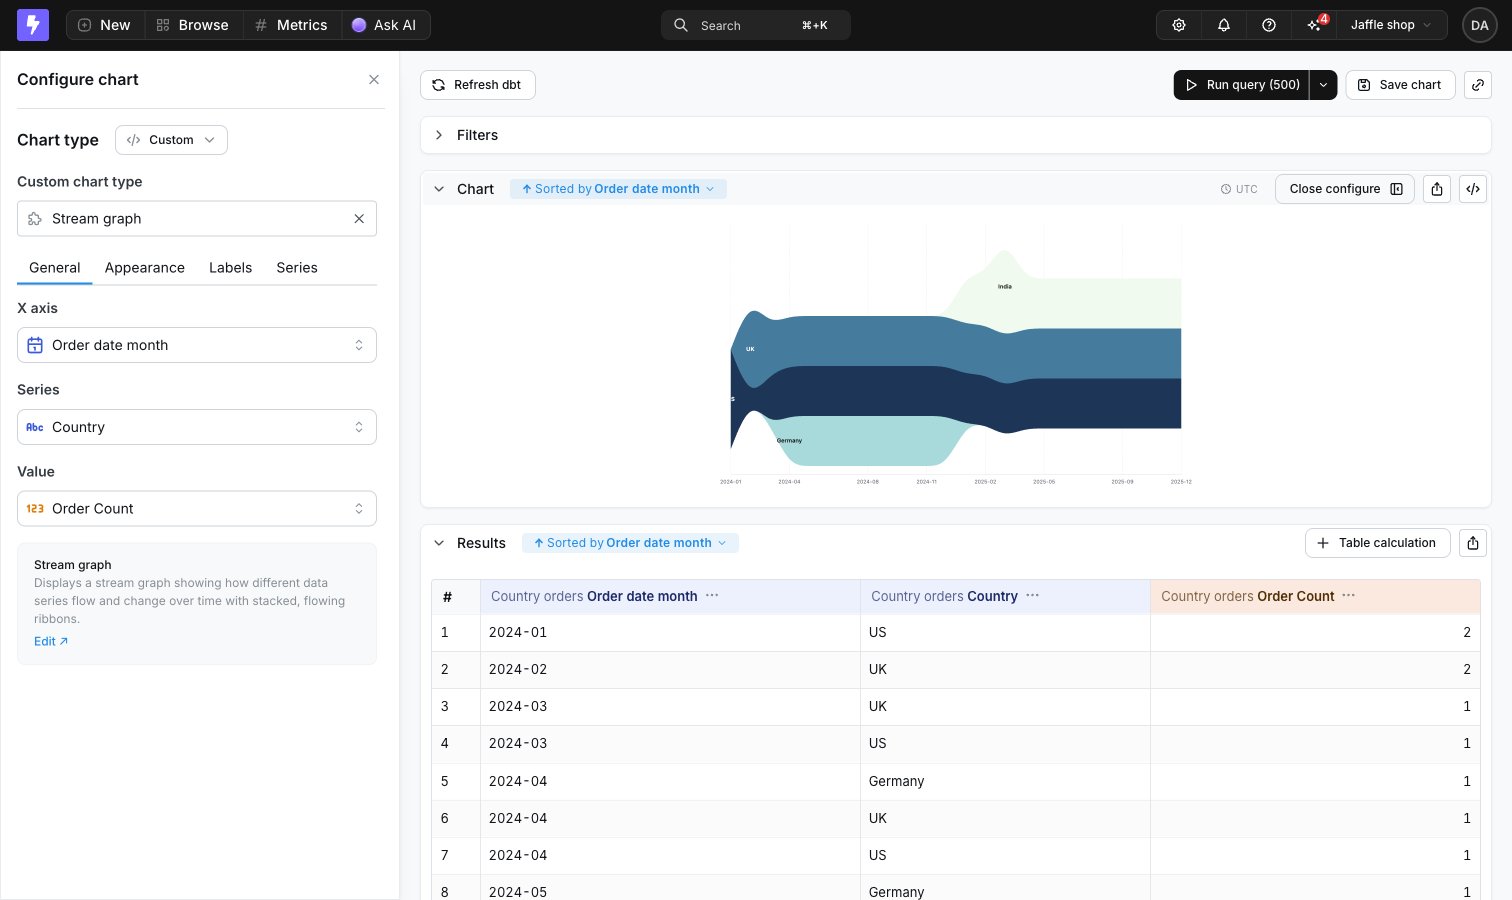
Map your fields
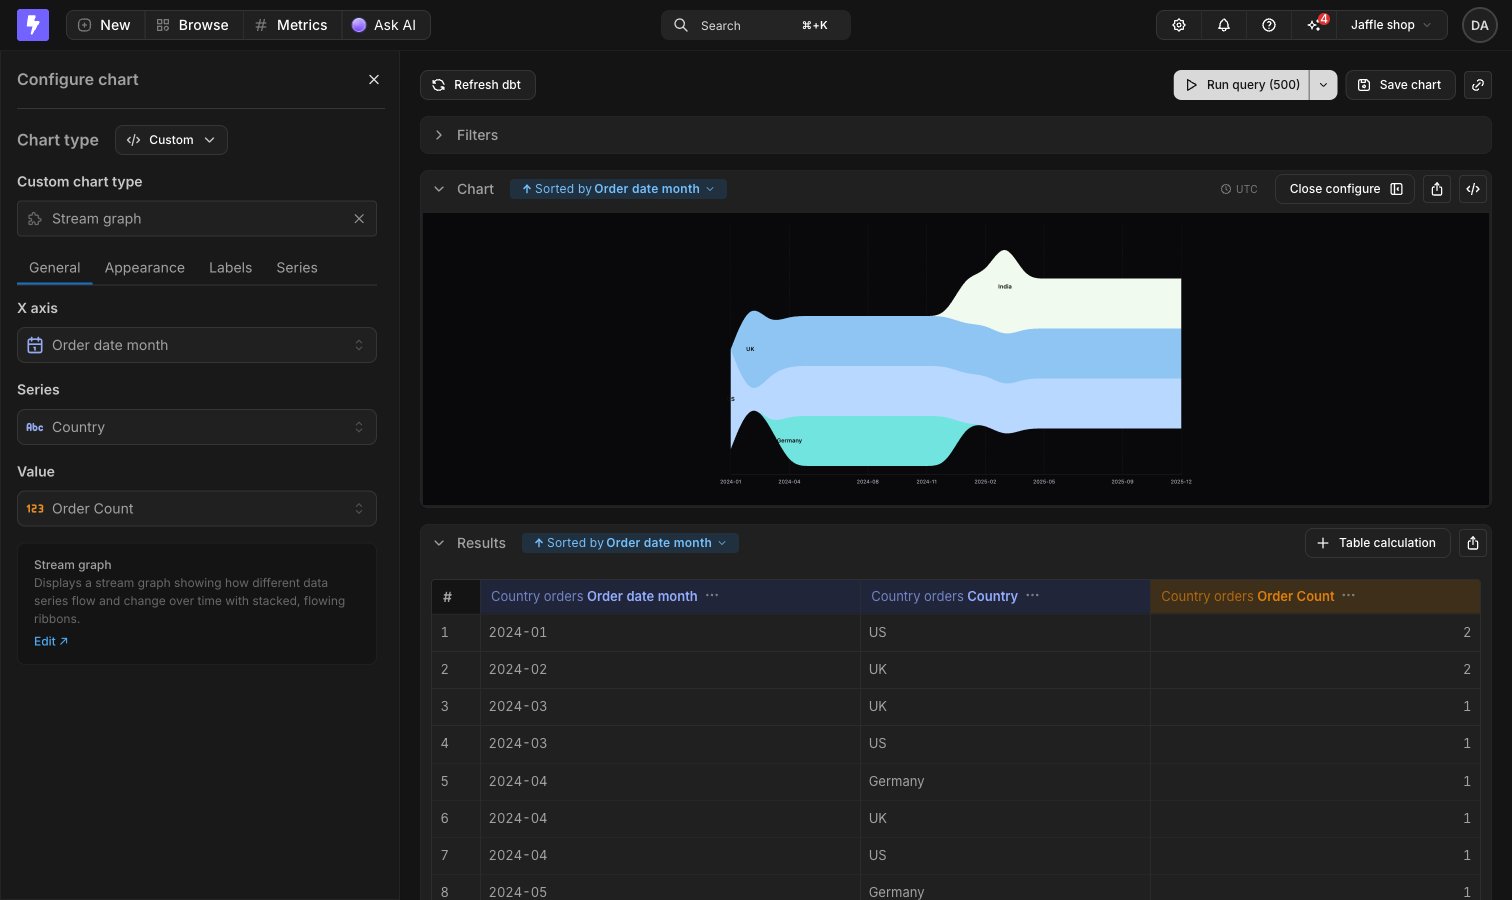
Each of the chart type’s inputs gets a field picker, the same as configuring axes on a bar or line chart. Required inputs can’t be cleared.
Saving and dashboards
Save the chart like any other chart. The saved chart remembers which chart type it uses and how its inputs are mapped. Saved charts render in chart view and as dashboard tiles, driven by each surface’s own query - dashboard filters and date zoom apply like any other chart tile.Chart types as code
Chart types round-trip through the CLI as their own resource, separate from data apps. Each one downloads tolightdash/chart-types/<slug>/ as a locally buildable project you can version in git, edit, validate with lightdash apps validate, and upload back:
slug in its lightdash-app.yml manifest, upserted in the target project on upload. The manifest also carries a vizSchema field with the chart type’s declared inputs, so the inputs round-trip with the source.
Saved charts reference their chart type by that slug in chart YAML (the dataAppVizSlug field), which keeps chart files portable across projects and instances:
- Downloading charts brings the chart types they render with along automatically, into
lightdash/chart-types/. - Uploading a chart resolves the slug in the target project. If the chart type doesn’t exist there, the chart upload fails with a message to run
lightdash upload --chart-types <slug>first. - Chart YAML written before slug references carries a
dataAppVizUuidinstead. Uploads accept it, but new downloads always write the slug.
--chart-types flags on lightdash download and lightdash upload for the full flag lists.
Permissions
Chart types are available across the whole project. They don’t live in spaces and can’t be moved into one.- Anyone who can view a chart can see the chart type it renders with.
- Editors and above can build new chart types.
- You can edit and delete the chart types you built. Project admins can edit and delete any of them.