

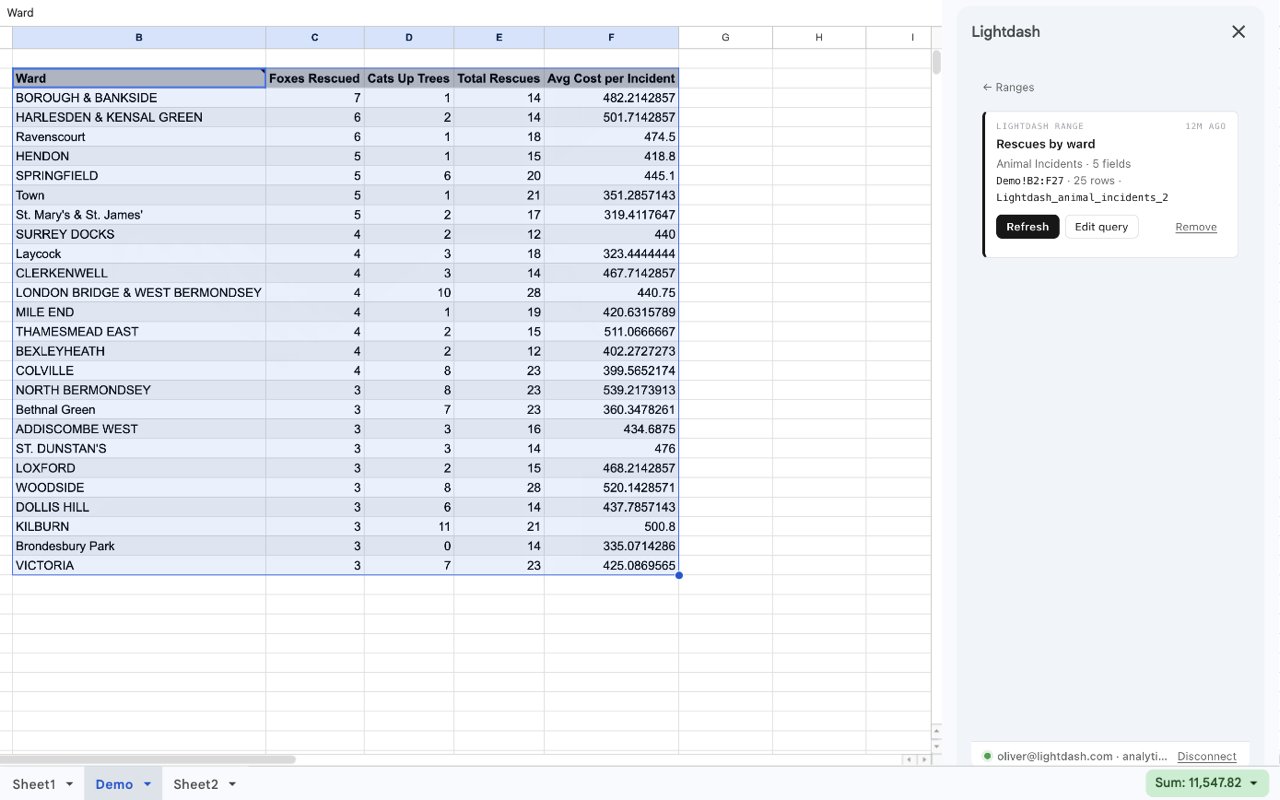
Ranges
A range is the block of cells a query wrote to, plus the query behind it. The sidebar opens on the list of ranges, grouped by worksheet in tab order. Each worksheet heading shows its name and range count. Ranges whose cells can no longer be found appear under Missing ranges, where you can remove them.- Refresh in place: re-running a range writes fresh results over the same cells. If the result grew, the range expands into empty cells below or to the right, or shifts content within its own columns and rows, provided that would not push another Lightdash range. Reports with row groups have additional space requirements. If the result shrank, the leftover cells are cleared.
- Several per sheet: put ranges side by side or on different tabs and refresh them individually, or use Refresh all from the sidebar or the Lightdash menu. For reports with row groups, follow the placement requirements.
- Accidental-edit warnings: each range has warning-only protection. Editing a protected cell shows a “Heads up” prompt, and you can choose to continue. For reports with row groups, only the headers are protected so the collapse controls work without warnings.
- Usable in formulas: the named range (for example
Lightdash_orders) works anywhere you’d reference cells, such as=SUM(Lightdash_orders). - Survives edits around it: inserting or deleting rows and columns elsewhere in the sheet keeps the range attached to its cells.
- Shared with collaborators: ranges are stored in the spreadsheet, so anyone who opens it sees the same list. Refreshing needs a Lightdash login, so each person connects their own account. Ranges are not carried over by File → Make a copy.
Build a query
- Select the cell where the results should start and choose New query.
- Pick a project, then an Explore, and add dimensions and metrics. Drag a dimension into Columns to pivot. The project and Explore pickers are searchable.
- Adjust filters and sorting and the row limit. Enable totals or row groups if needed.
- Choose Insert. The sidebar shows where the results will go and follows your selection while you build. If the selected cell is inside an existing range, pick a cell outside it first.
Filters
Filters defined in your dbt models are respected:required_filters are prefilled and can’t be removed (values are still editable), while default_filters are prefilled but can be adjusted or removed. Add your own dimension and metric filters with + Add filter, then search the field picker to choose a field.
For is and is not filters on text, numeric, or boolean dimensions, search the suggested values and select one or more. Selections appear as removable chips. Use Select all or Select all matches to select the available results, and Clear all to remove the selection. Model-defined suggestions and labels are respected.
The picker shows up to 100 suggestions. When more values are available, narrow your search to enable bulk selection. You can also type a value and press Enter to add it, including when suggestions cannot load.
Import a saved chart
Use an existing saved Explore chart as the starting point for a report:- Choose Import saved chart from the Ranges page.
- Paste the chart URL from your connected Lightdash instance and choose Load chart.
- Review or adjust the query in the builder, select a destination cell, and choose Insert.
fromDashboard navigation parameter is accepted. Nested AND filters are supported.
Sorting and row limits
Under Sort, choose a selected field and ascending or descending order. Use + Add sort for additional rules and the arrows to change their priority. Sorting is saved with the range and reused when editing, refreshing, or refreshing all ranges. Removing a field also removes its sort rule. Flat reports can sort by selected dimensions and metrics. Pivots can sort by row dimensions; without explicit rules, pivot rows sort ascending. When row grouping is enabled, the order of fields in Rows sets the sort priority, and you can choose a direction for each level. Select Row limit below the insert or update button to set the limit from 1 to 5,000 rows; the default is 500. Sorting applies before the limit, so sorting a metric descending with a limit of 100 returns the top 100 results. The add-on fetches all result pages up to the configured limit before writing to the sheet. Group labels and totals rows are additional to the detail-row limit and displayed row count.Totals
Use the checkboxes under Totals to include totals in the report:
Lightdash calculates totals in the warehouse using the metric definitions, including averages, ratios, and distinct counts. Totals cover all matching data after filters, regardless of the displayed row limit or pivot-column cap. A total can therefore include data that is not visible in the sheet.
Totals are off until enabled and are saved with the range. Empty results do not add a totals row. If your Lightdash instance cannot calculate a requested total, or returns incomplete totals, the report fails before writing cells. Retry or turn off totals.
Row groups
Enable Group rows with 2–9 dimensions in Rows to expand and collapse detail using the native Sheets + / − controls. The order of row fields defines the hierarchy, and each group has a bold label. Both flat reports and pivots support grouping. Metrics are optional. When selected, Lightdash calculates subtotals for the group rows using the metric definitions and filters. Subtotals can include matching detail beyond the row limit. If your Lightdash instance cannot calculate the required subtotals, the update stops before cells or groups change. New groups start expanded. Refresh preserves the collapsed state of groups with the same fields and values. Grand totals stay outside the collapsible groups. Turning grouping off or removing the range removes its groups and reveals their detail rows. Groups hide entire worksheet rows. Use separate rows or worksheets for independent reports: the add-on refuses grouping beside other content or managed ranges, and refuses to overwrite unrelated row groups. Grouped reports need empty space to grow; they do not shift surrounding content. If row groups are manually restructured, ungroup the affected rows before refreshing. A range supports up to 200 groups. If a report exceeds that limit, add filters or reduce its row limit.Manage a range
Select a range in the sidebar list to open it. From there you can:- Refresh to re-run the query.
- Edit query to reopen the builder with the saved query loaded. Update range rewrites the same cells with the new result.
- Rename by selecting the range’s name.
- Remove to delete the saved query and its protection, keeping or clearing the cells.